Before charts are available to Subscribers..
Click on the chart to make it big
BEFORE CHARTS
AFTER CHARTS
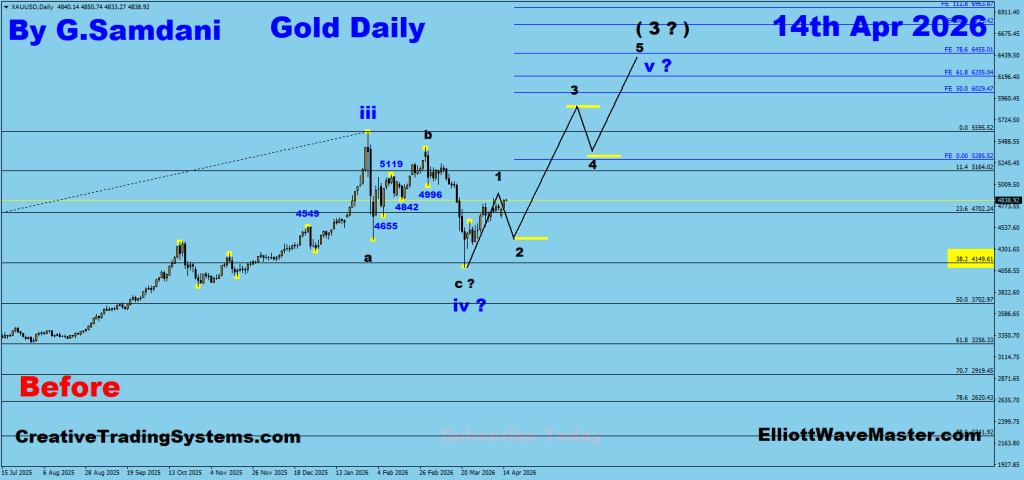
Gold ” Before “. 04-14-26.
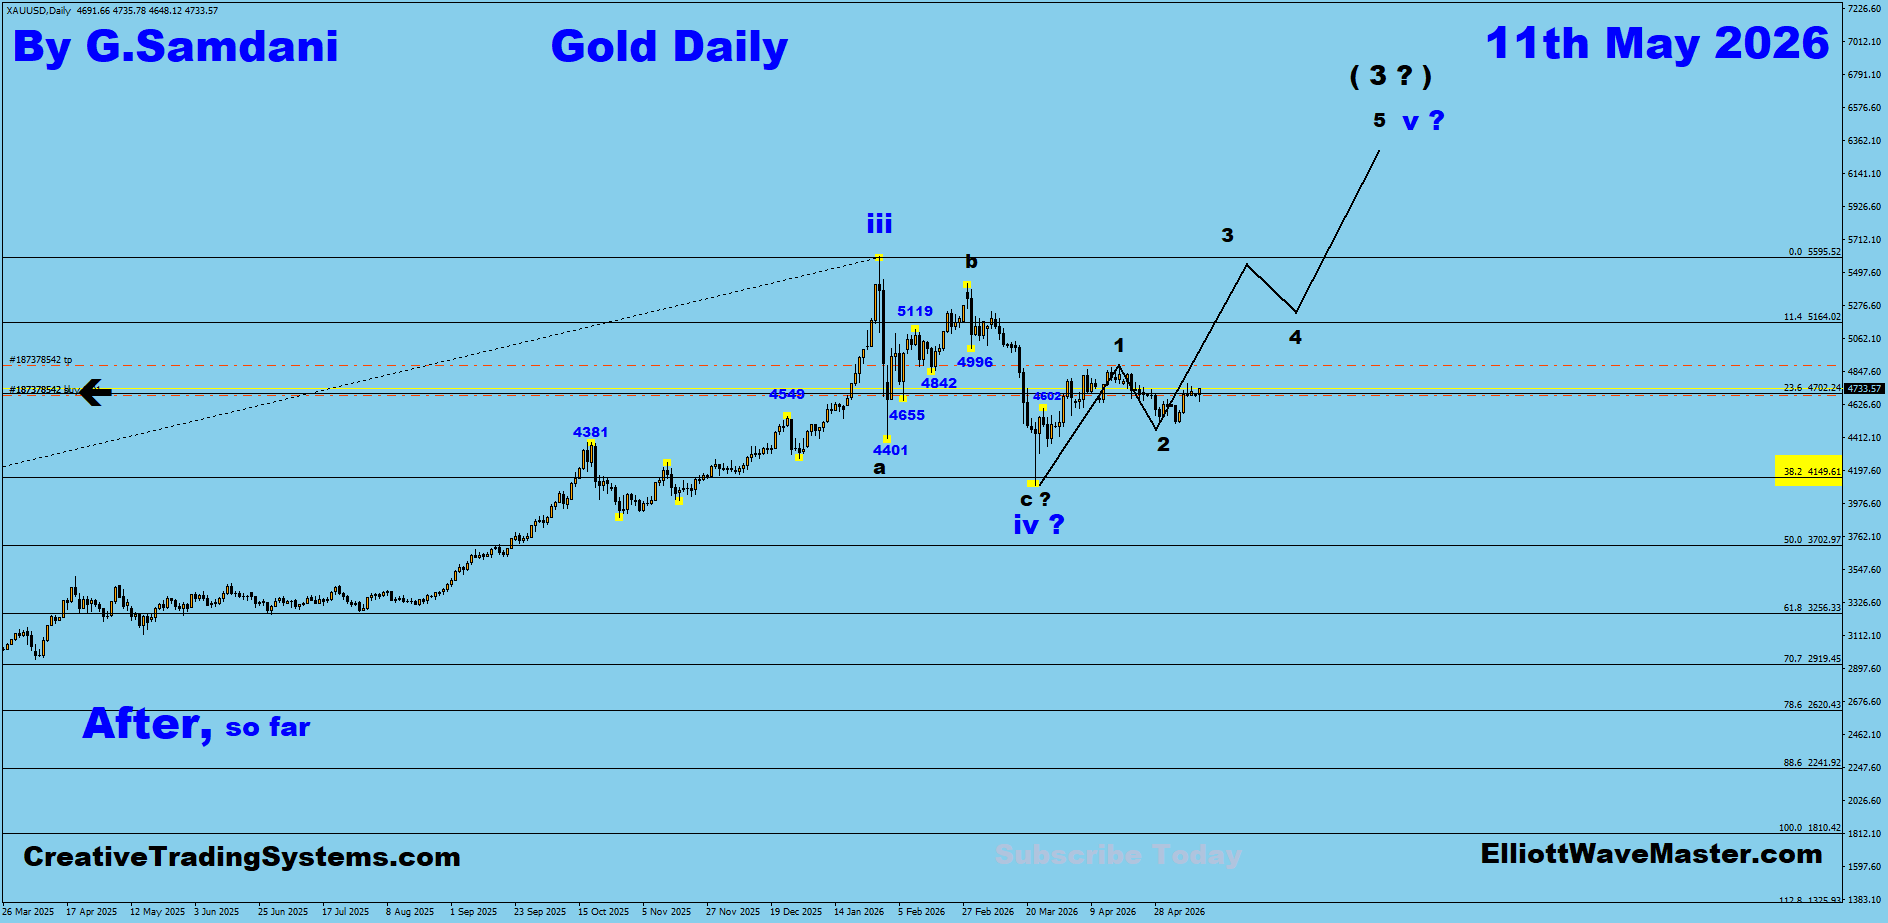
Gold ” After, so far “.
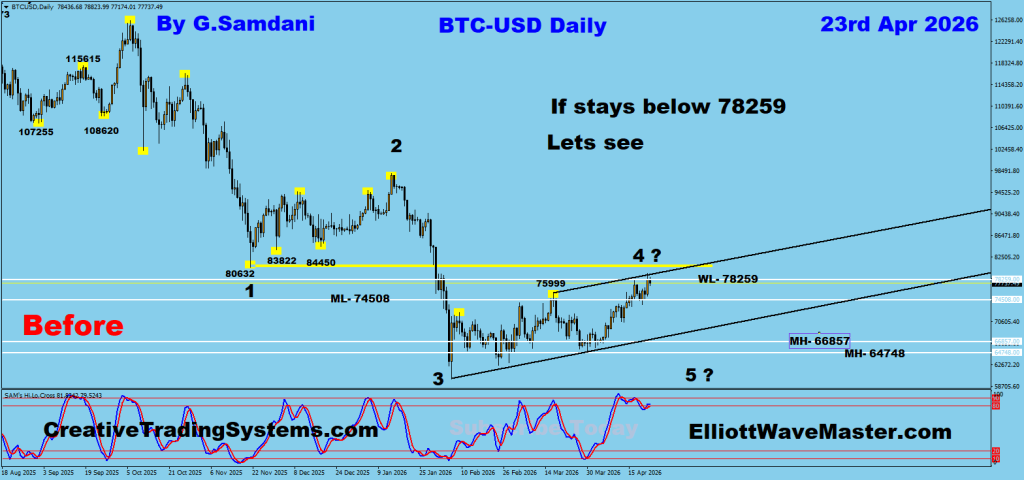
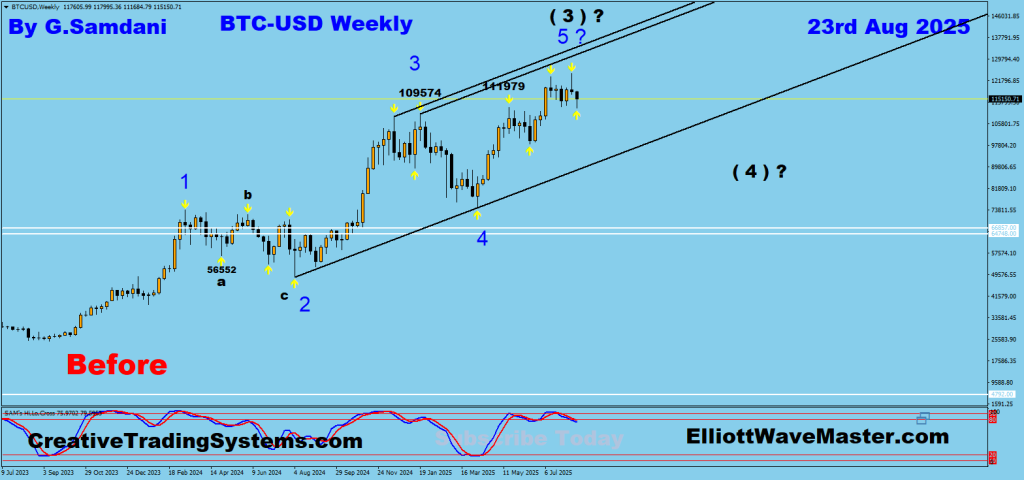
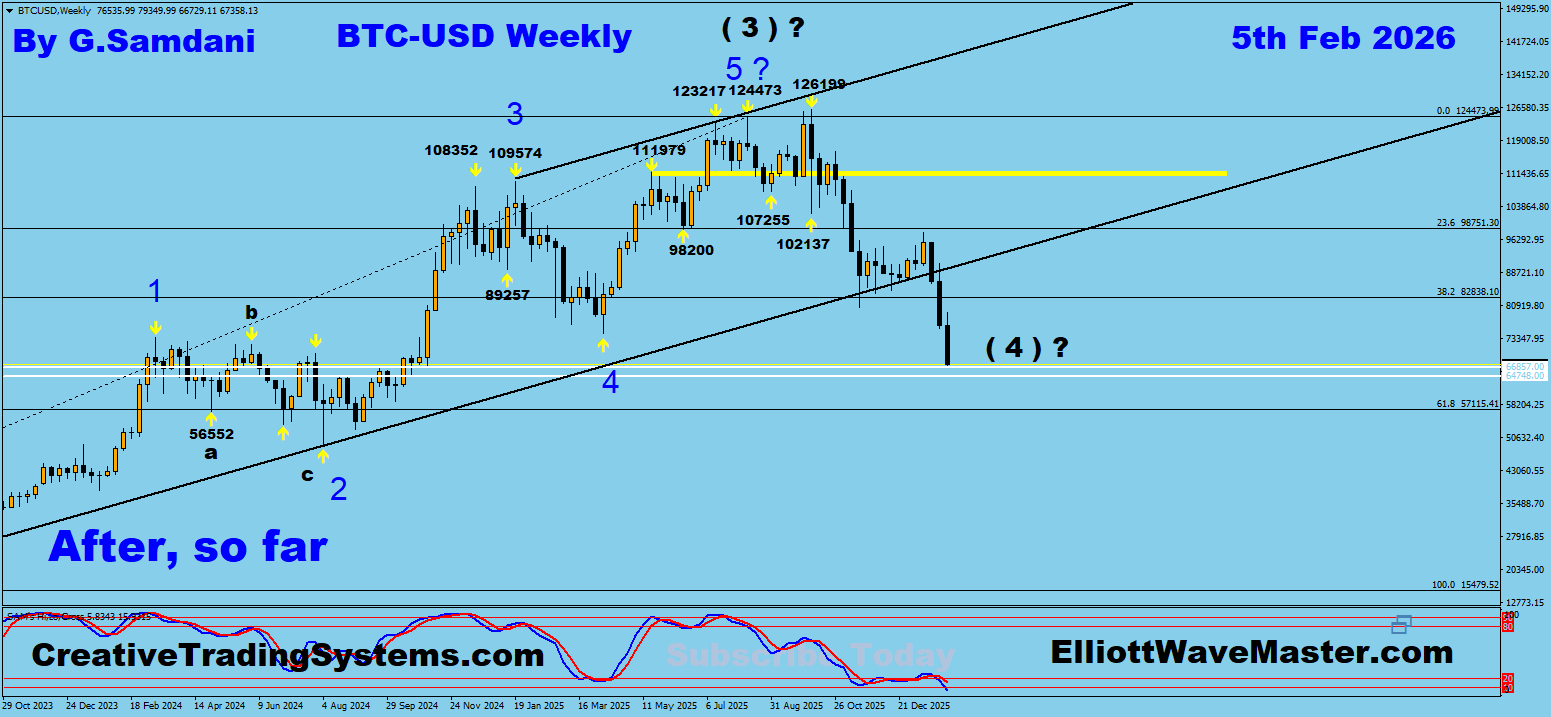
Bitcoin ” Before “. 04-23-26.
Bitcoin ” After ” Waiting.

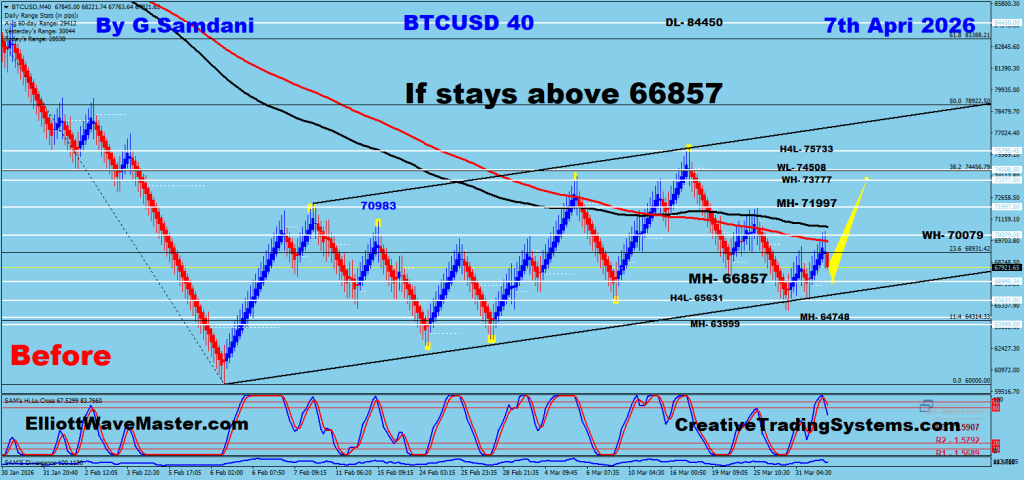
Bitcoin ” Before “. 04-07-26.
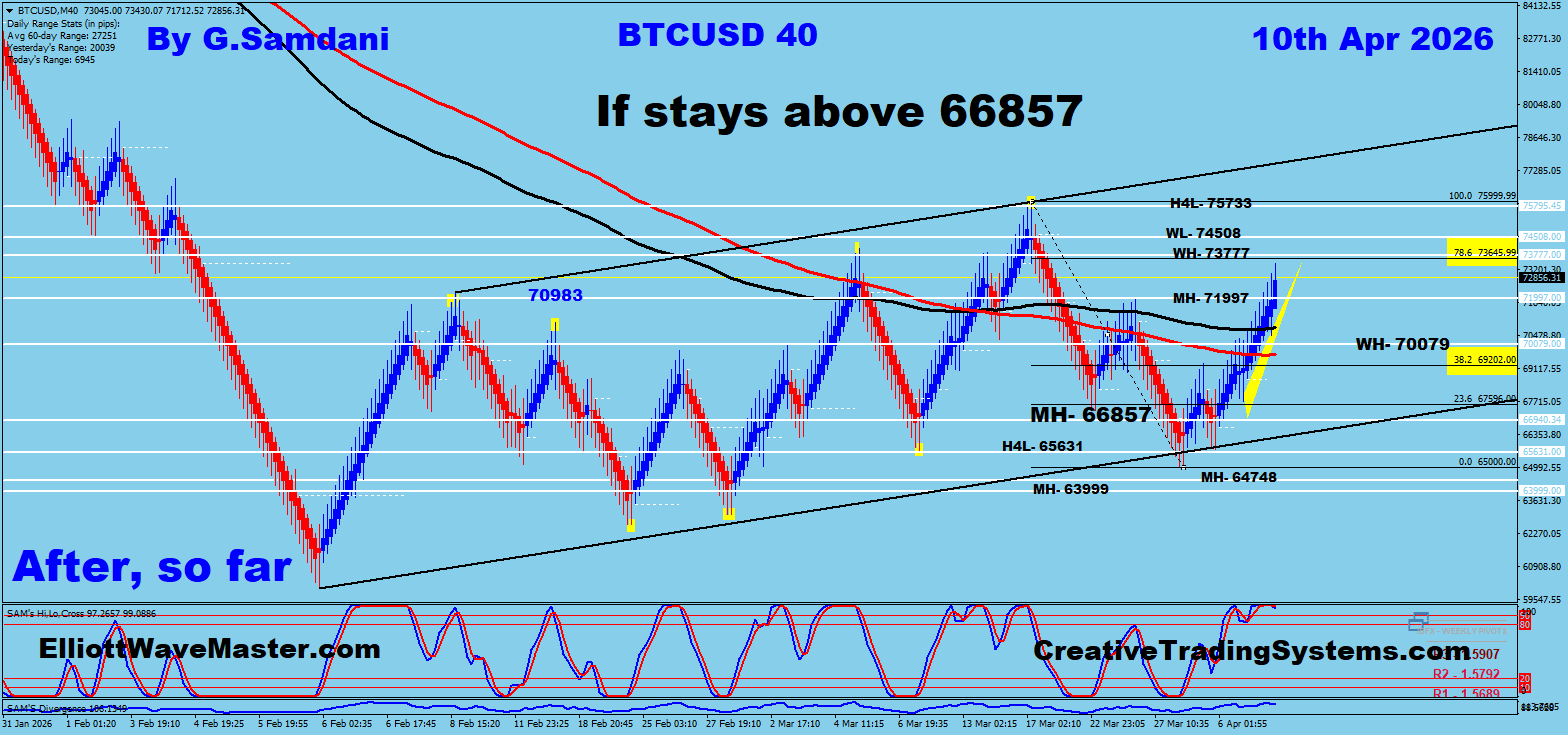
Bitcoin ” After ” .04-10-26
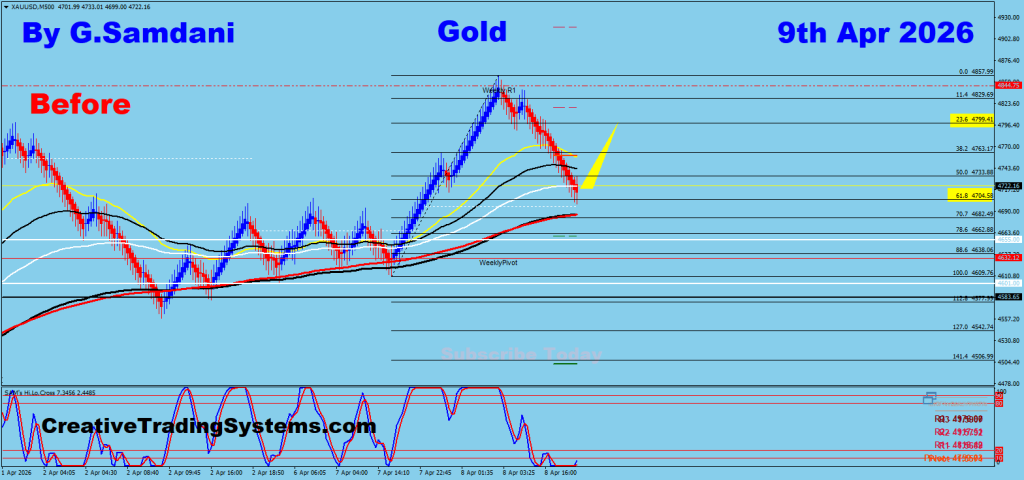
Gold ” Before “. 04-09-26.
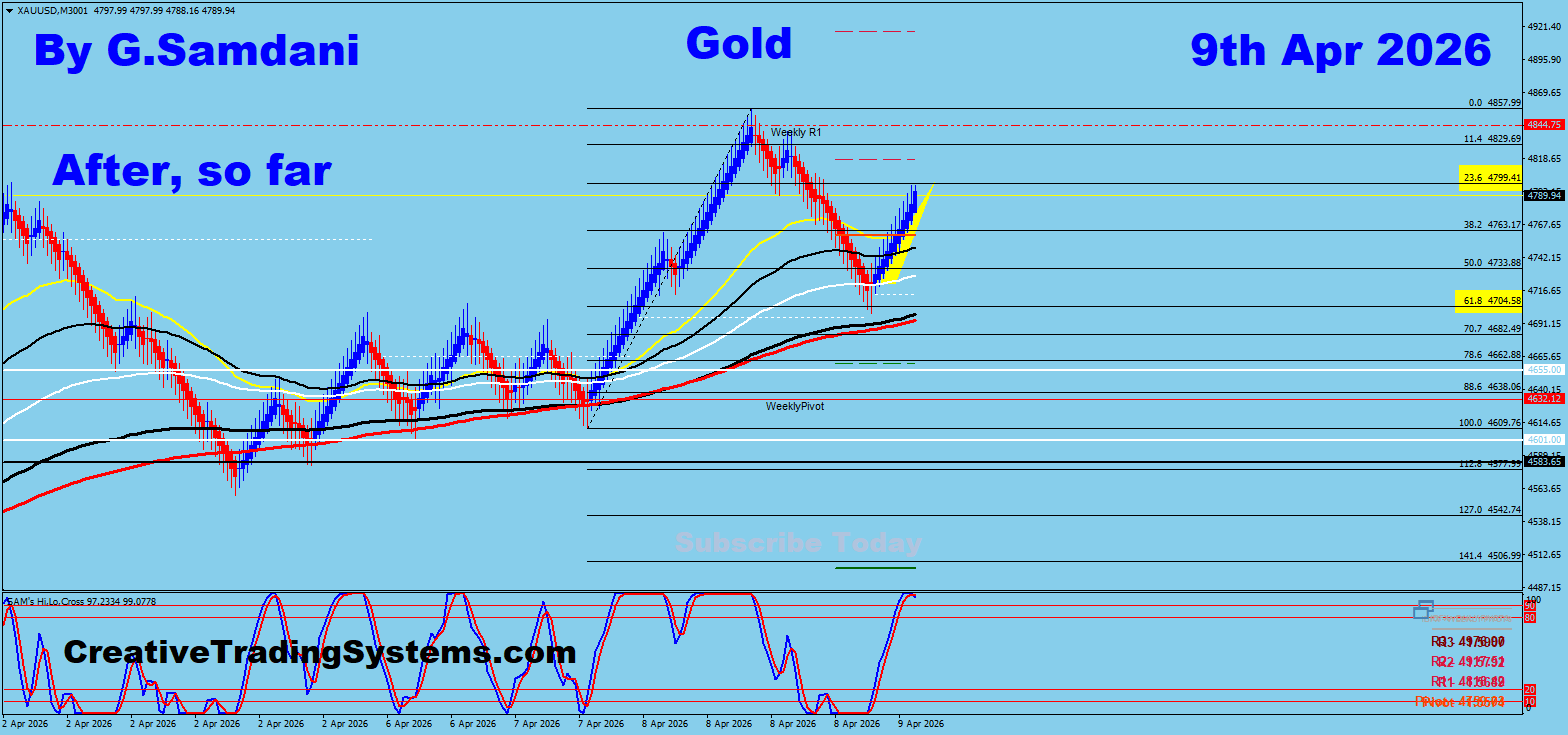
Gold ” After ” .04-09-26
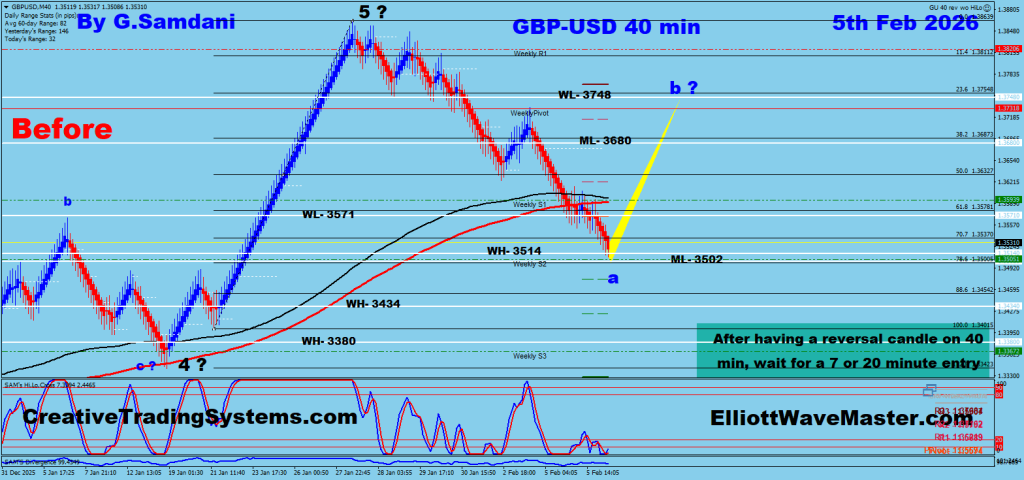
GBP-USD ” Before “. 04-01-26.

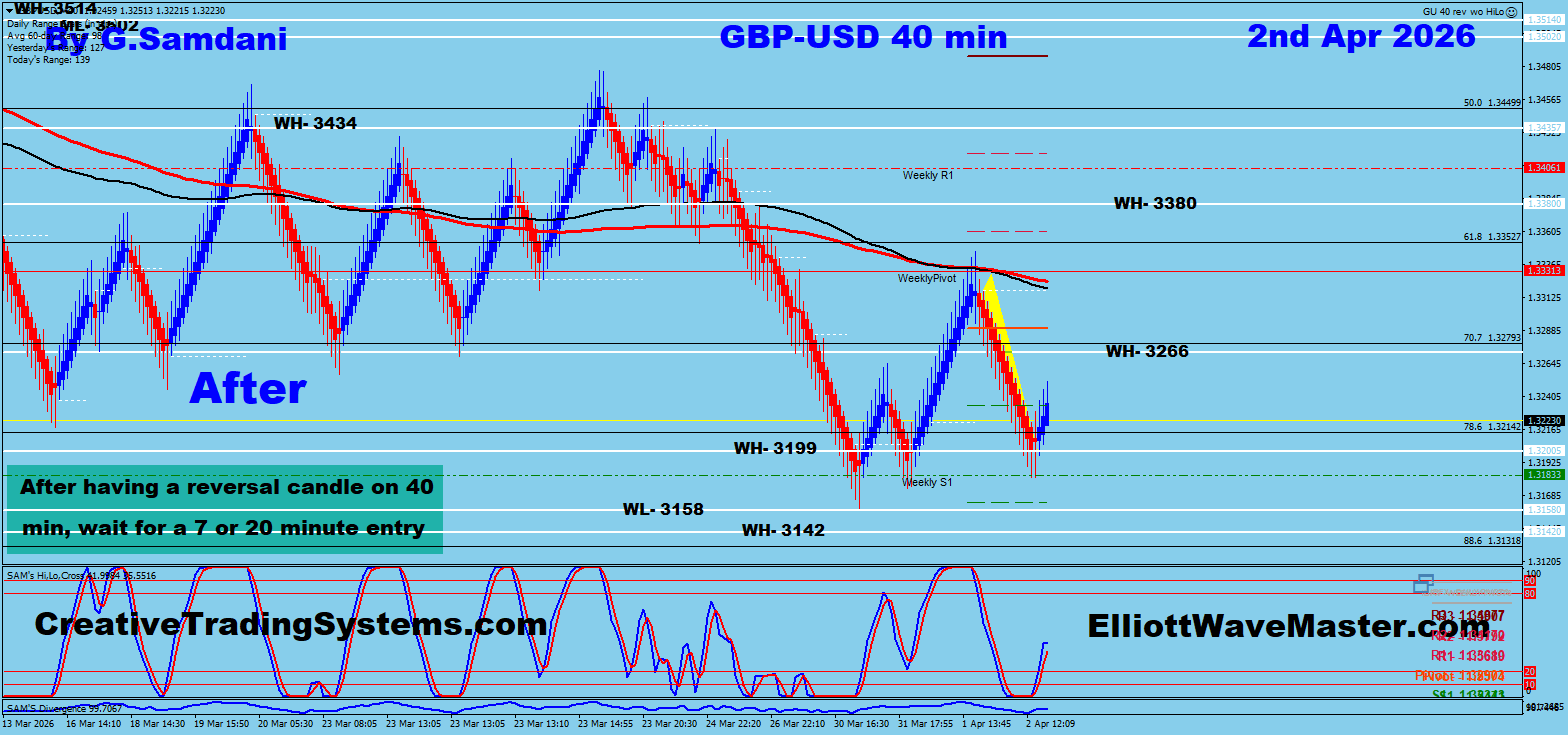
GBP-USD ” After ” 04-02-26
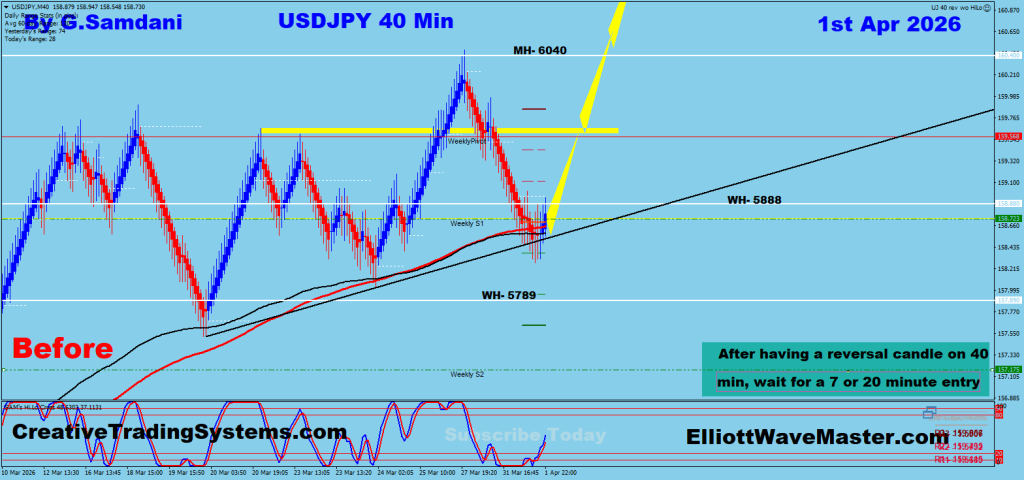
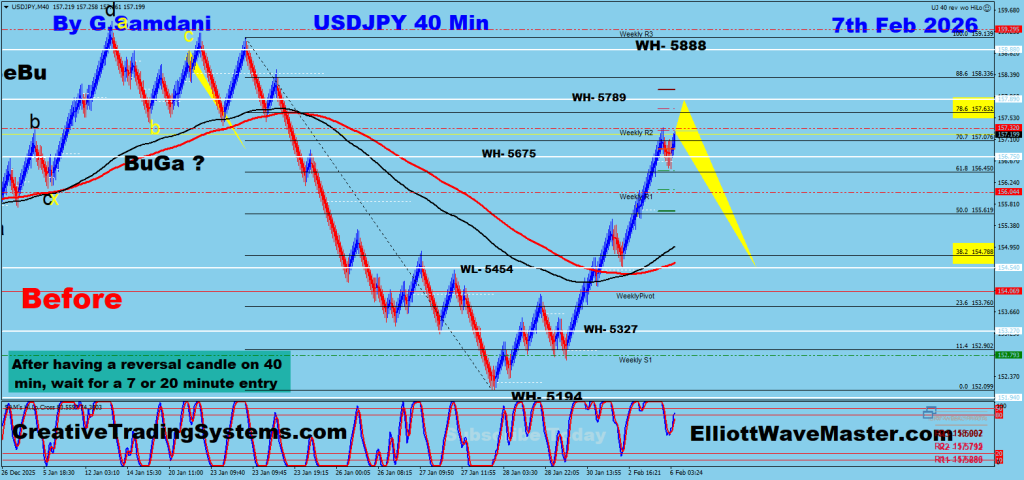
USD-JPY ” Before “. 04-01-26.
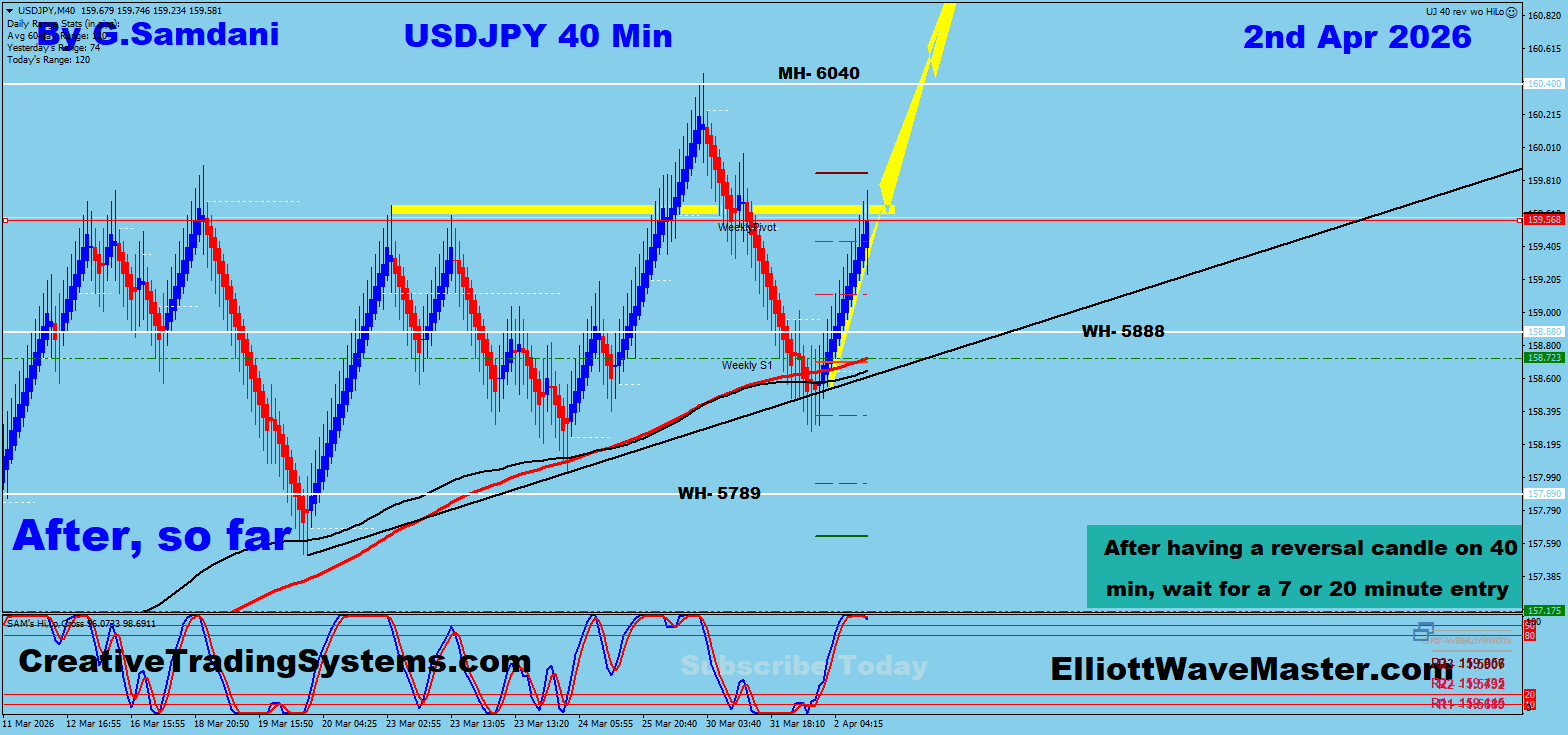
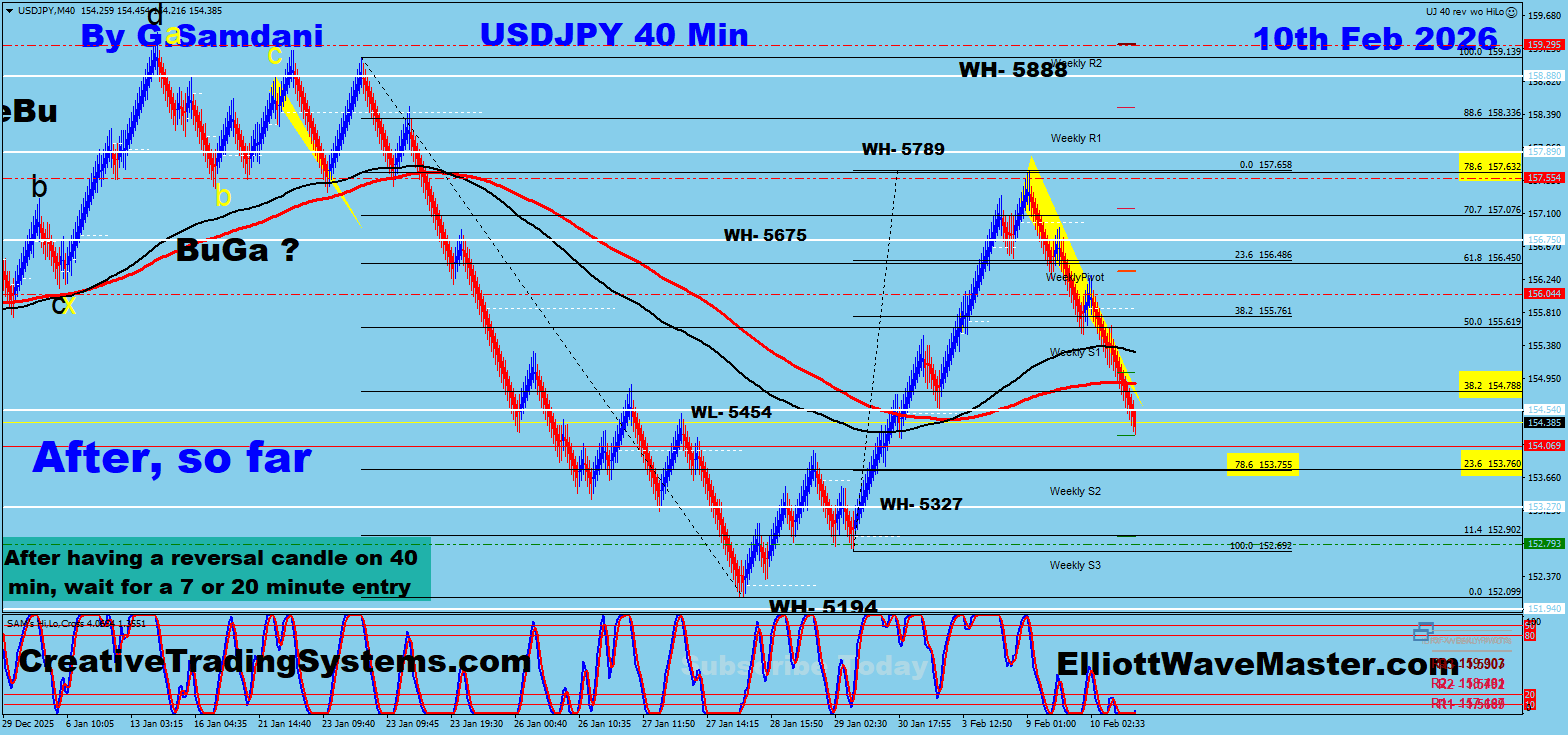
USD-JPY ” After ” 04-02-26.
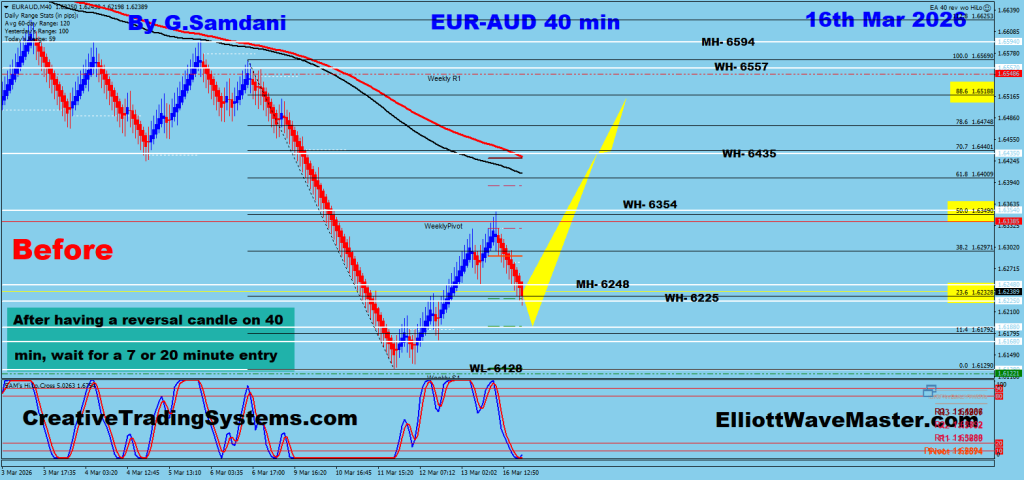
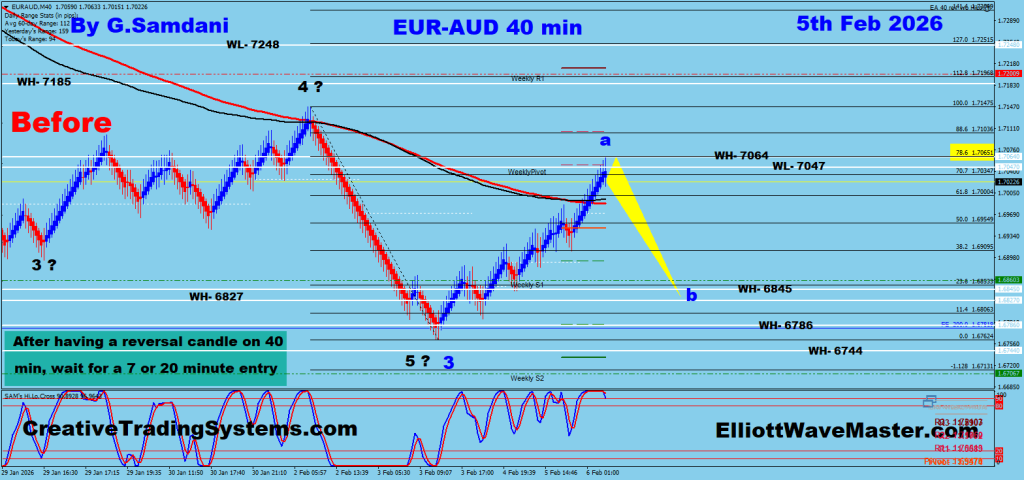
EUR-AUD ” Before “. 03-16-26.
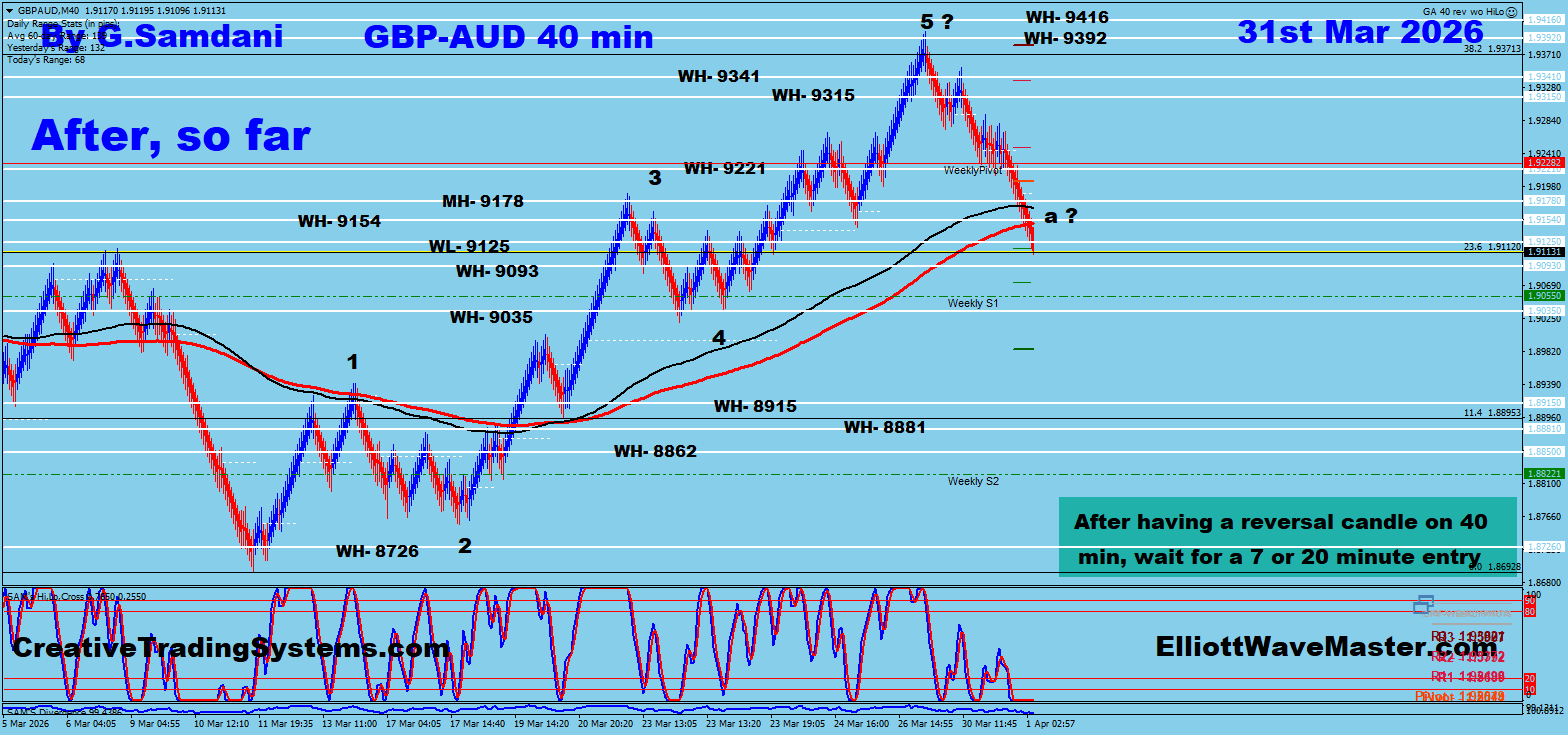
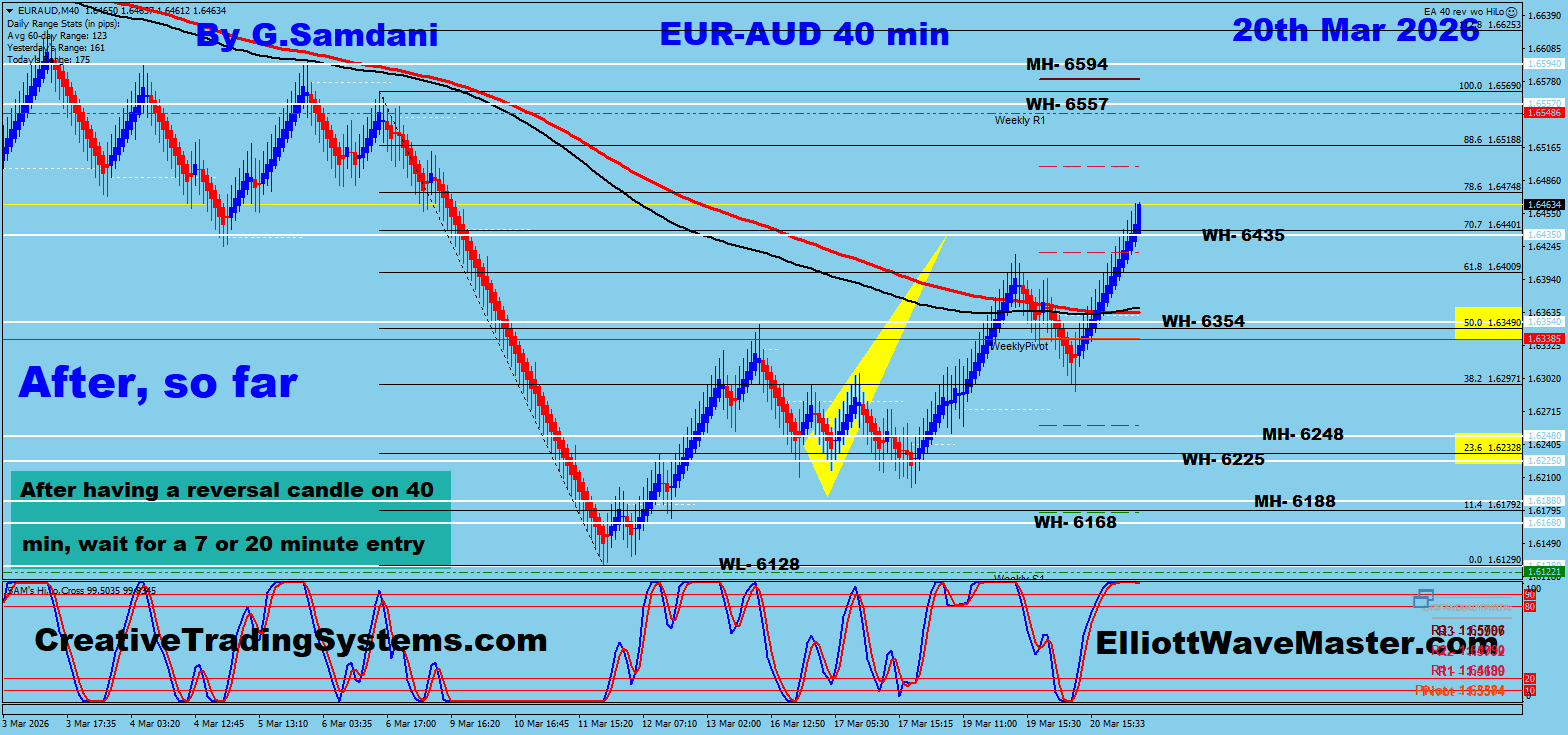
EUR-AUD ” After ” 03-20-26.
EUR-AUD ” Before “. 03-16-26.
EUR-AUD ” After ” 03-20-26.
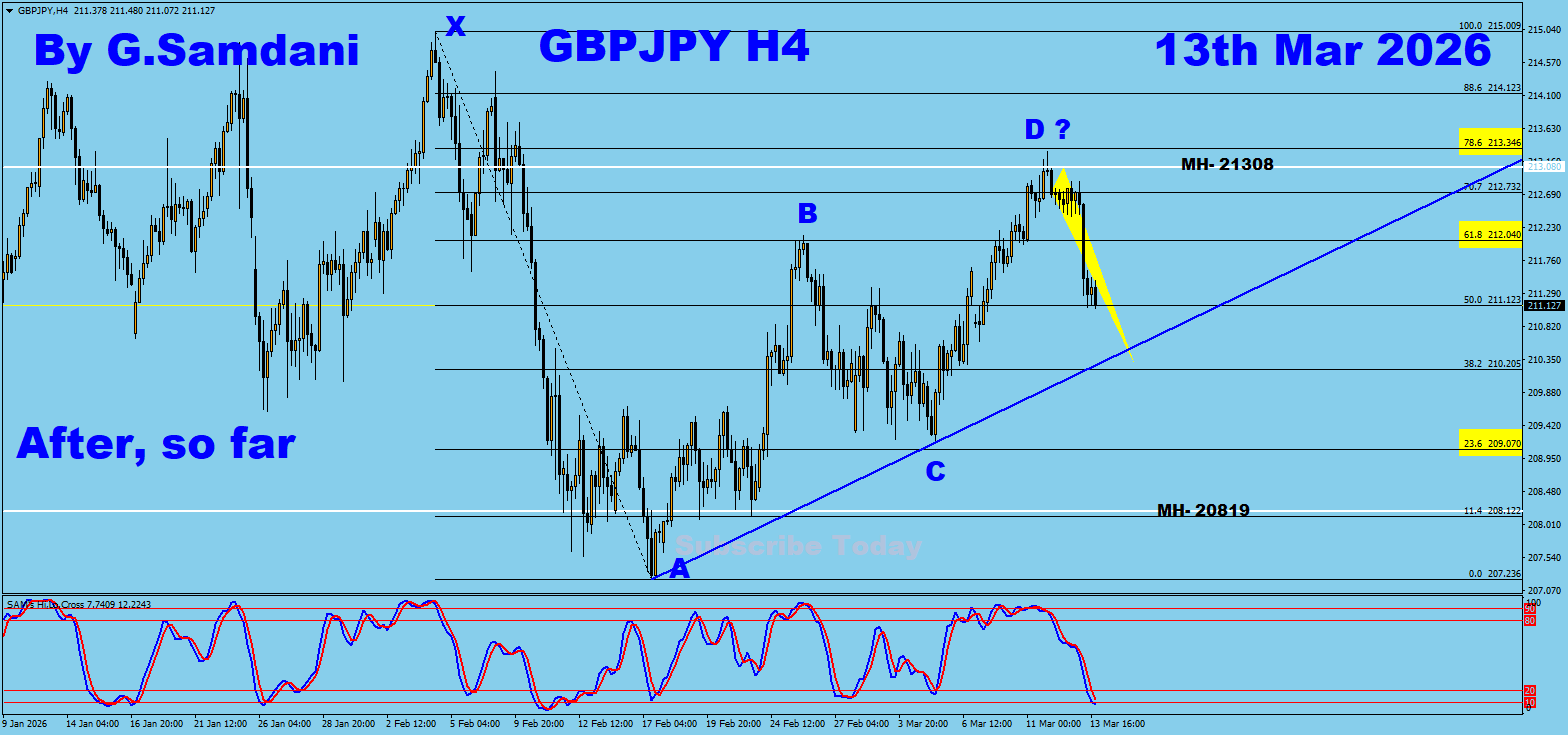
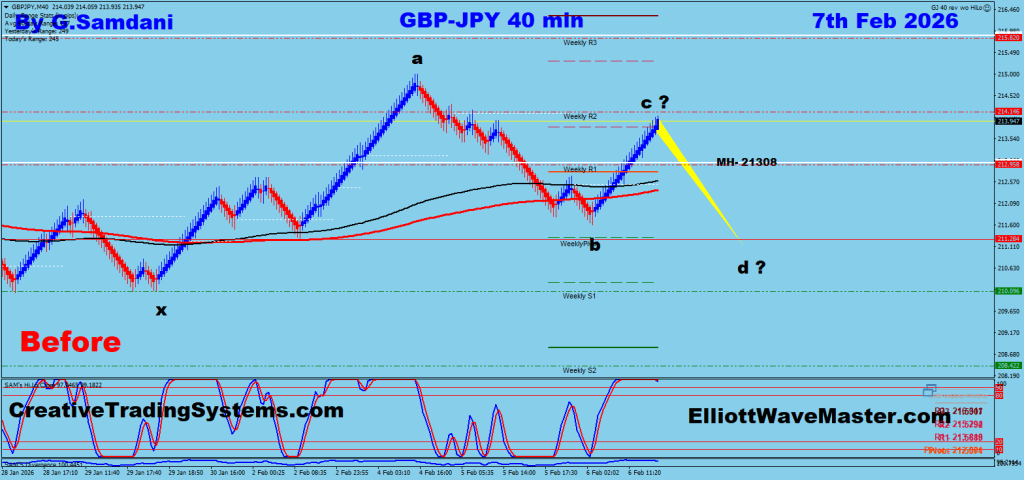
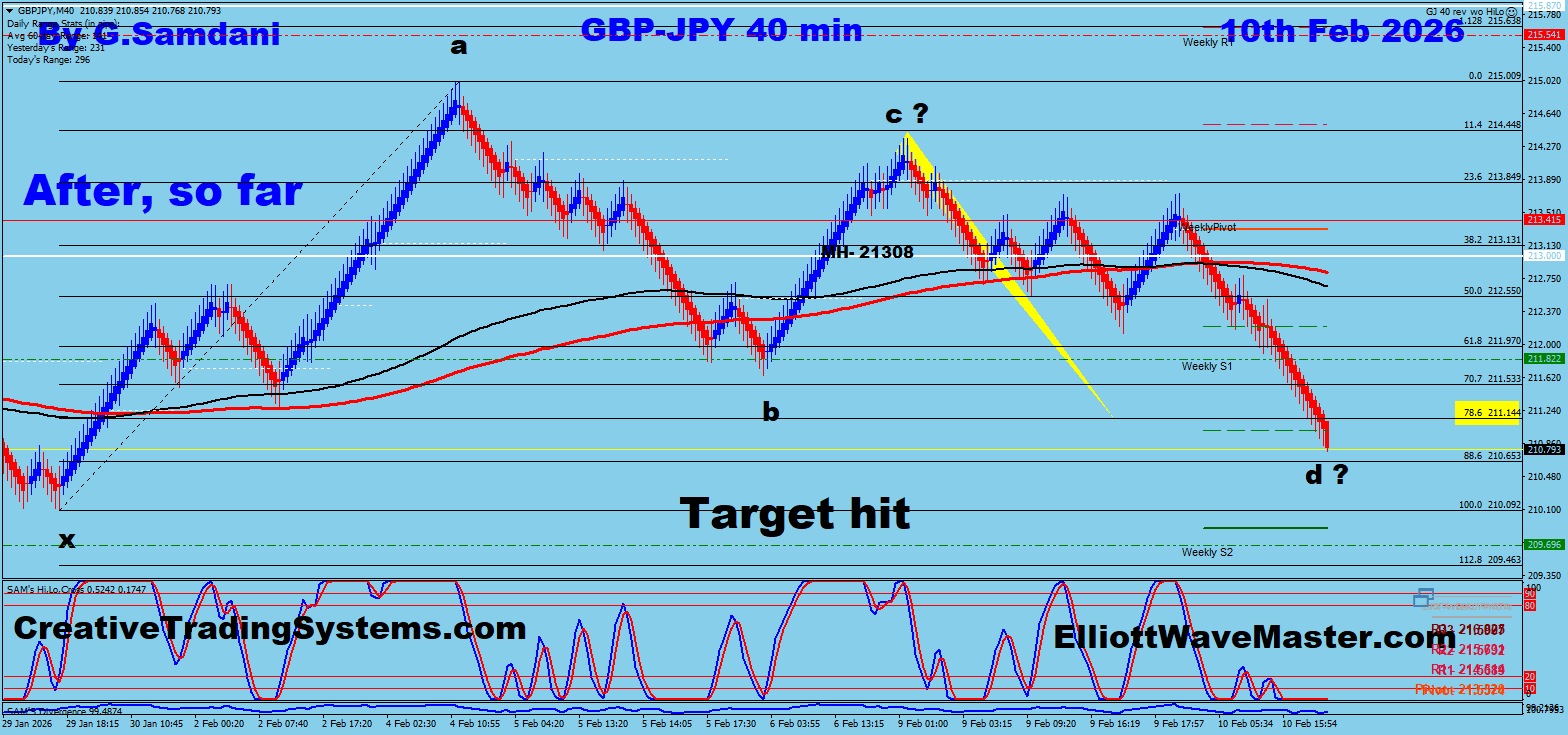
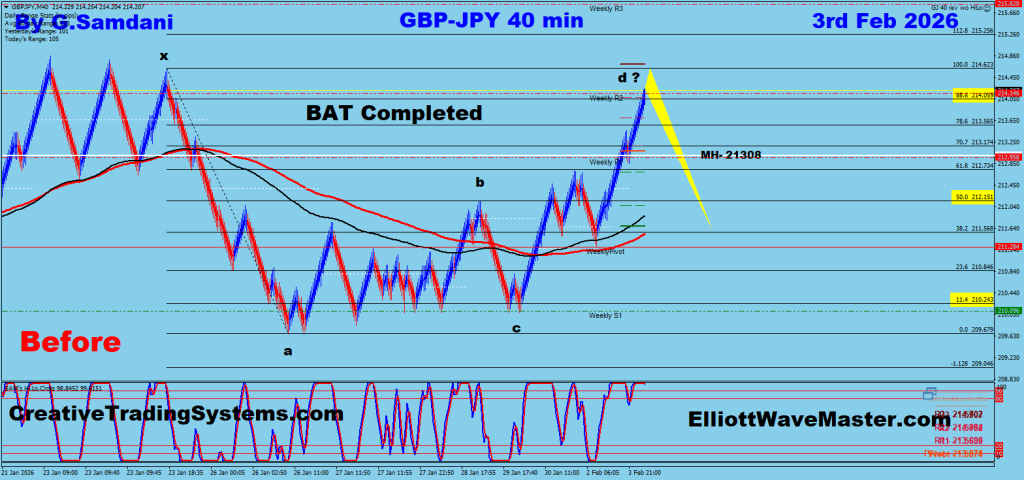
GBP-JPY ” Before “. 03-11-26.
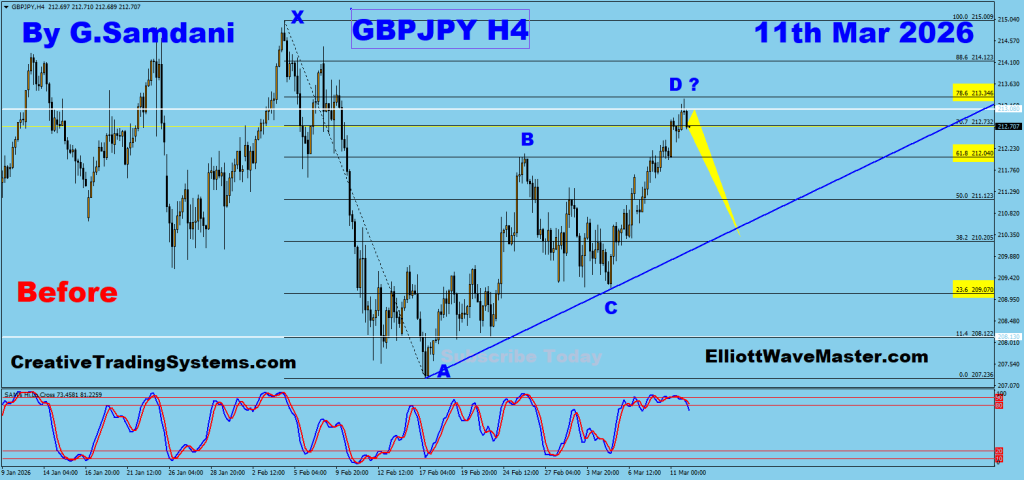
GBP-JPY ” After ” 03-13-26.
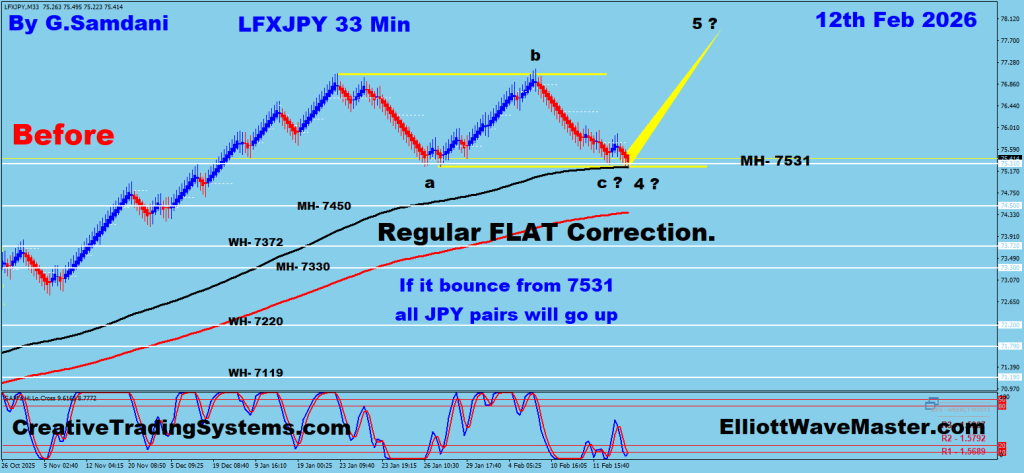
JPY Index ” Before “. 02-12-26.
JPY Index ” After ” 03-11-26

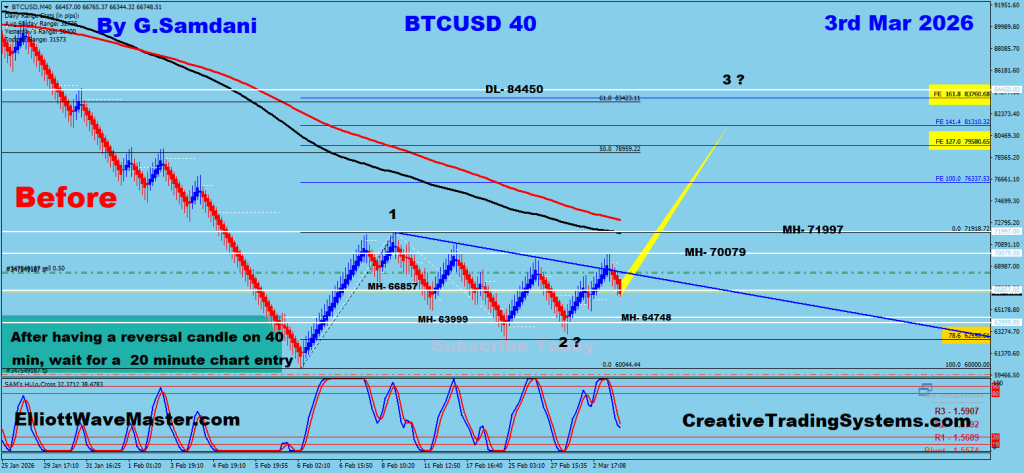
Bitcoin ” Before “. 03-03-26.
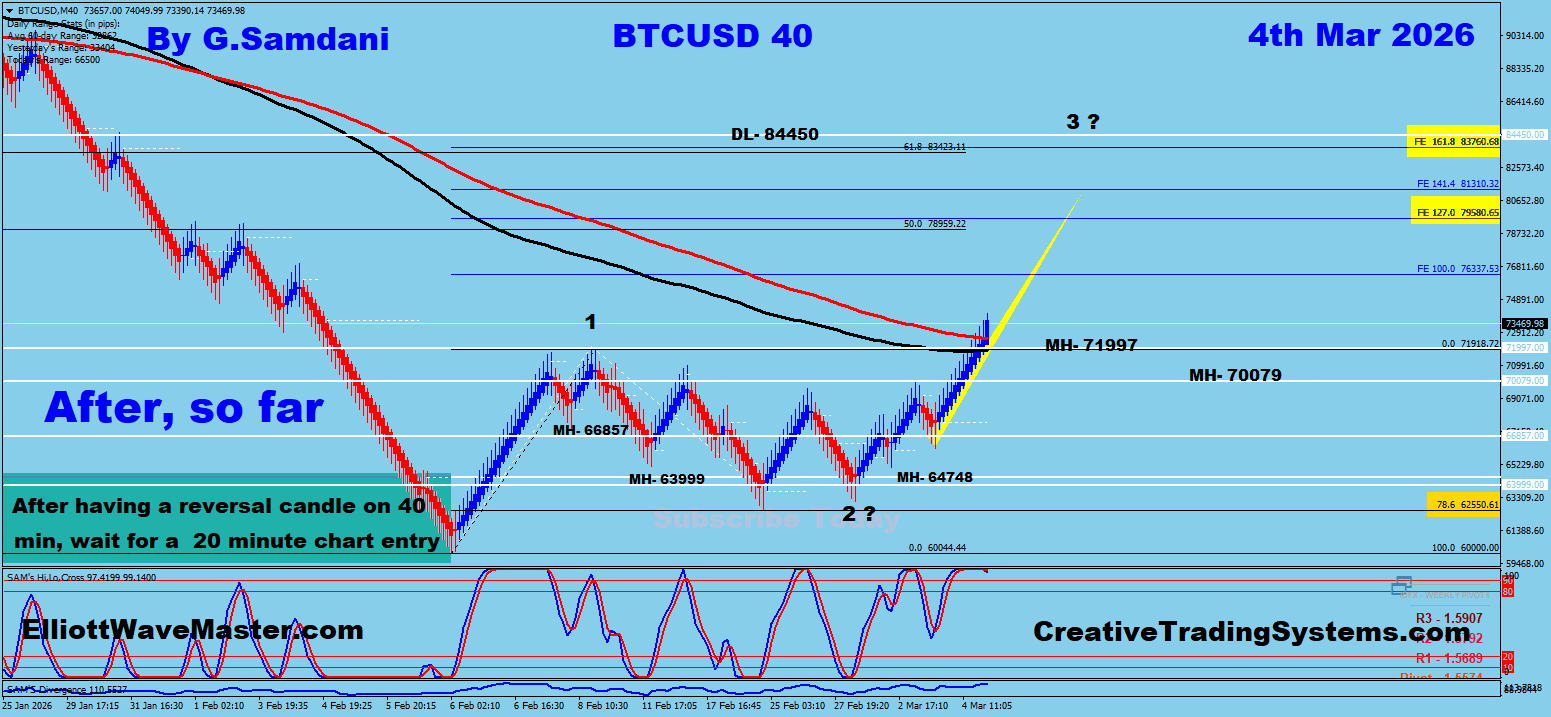
Bitcoin ” After ” 03-04-26
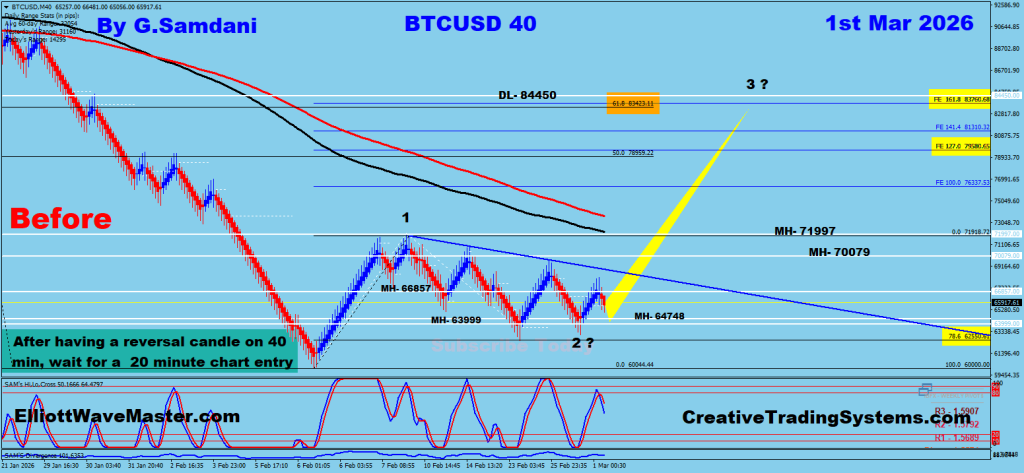
Bitcoin ” Before “. 03-01-26.
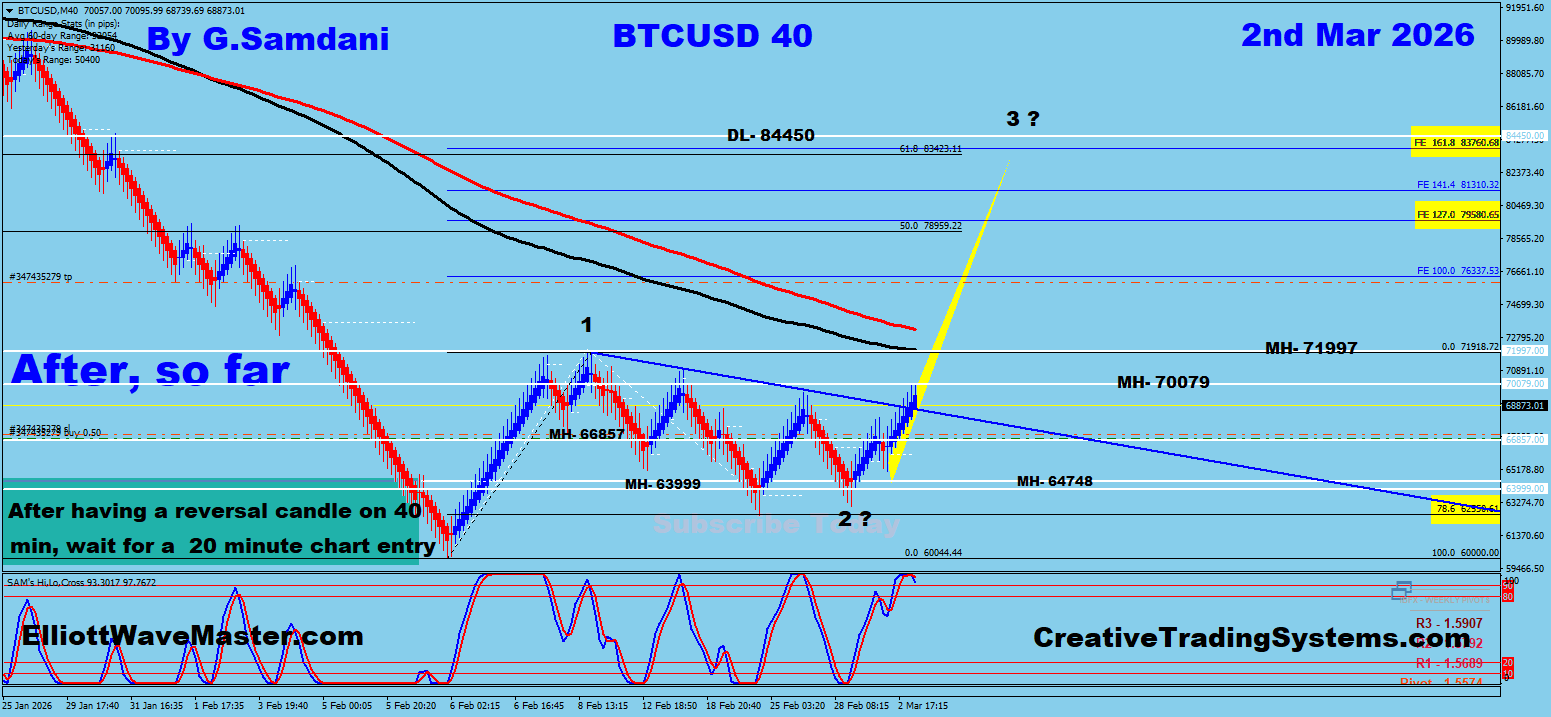
Bitcoin ” After ” 03-02-26
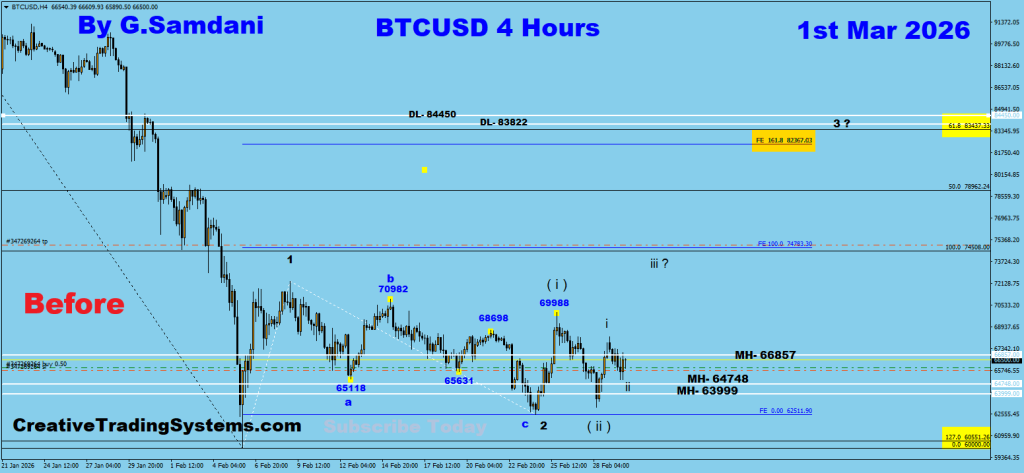
Bitcoin ” Before “. 03-01-26.
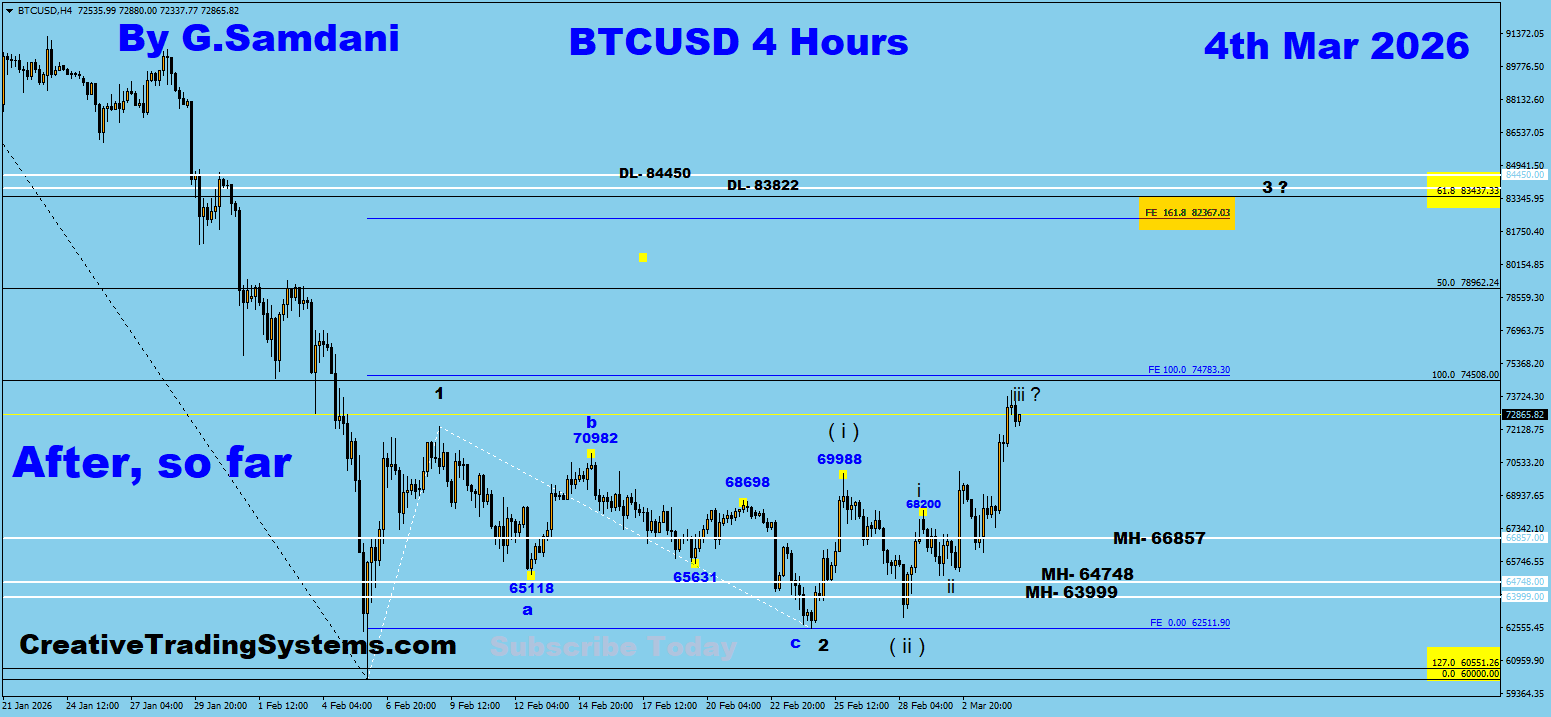
Bitcoin ” After ” 03-04-26
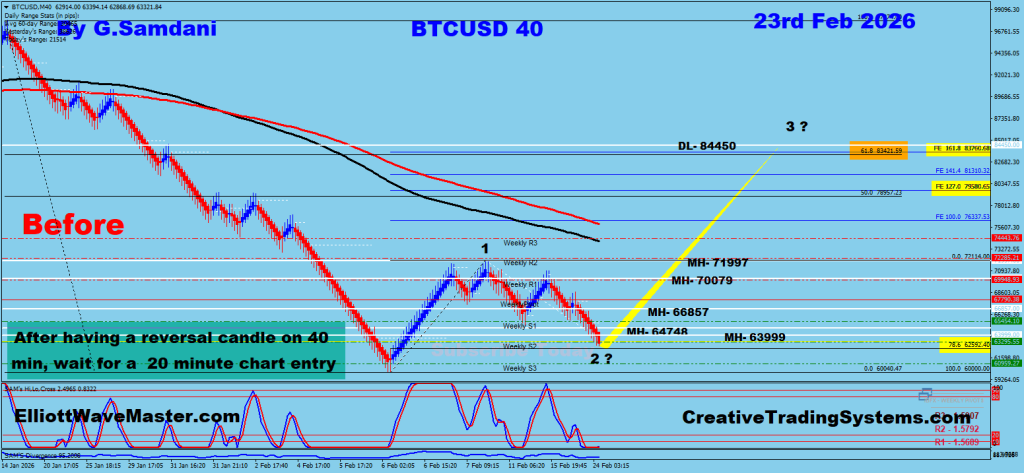
Bitcoin ” Before “. 02-23-26.
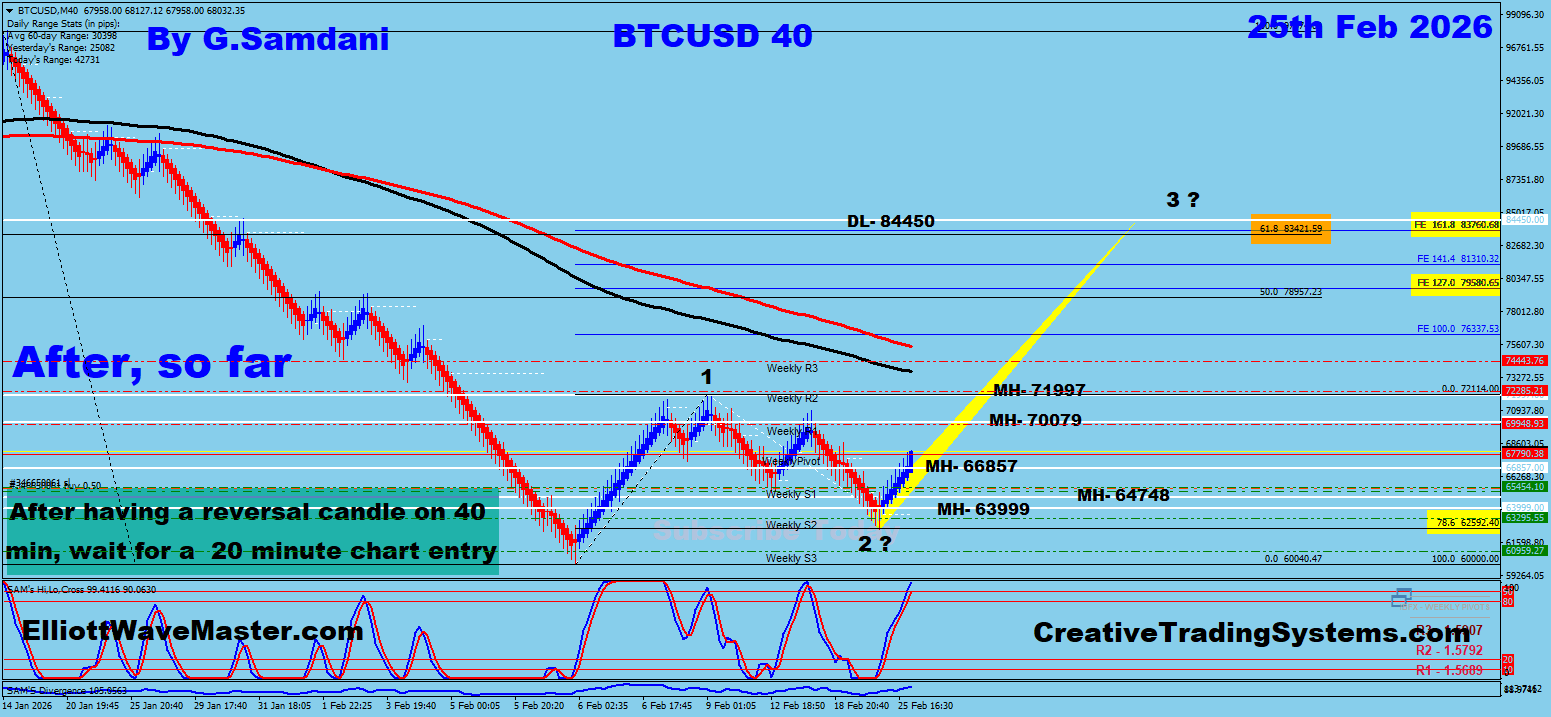
Bitcoin ” After so far ” 02-25-26
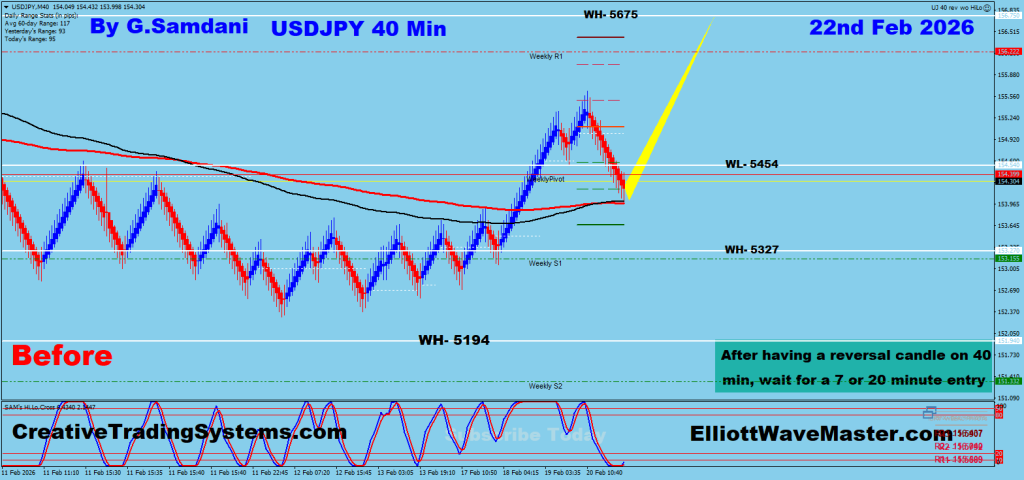
USD-JPY ” Before “. 02-22-26.
USD-JPY ” After ” 02-25-26.

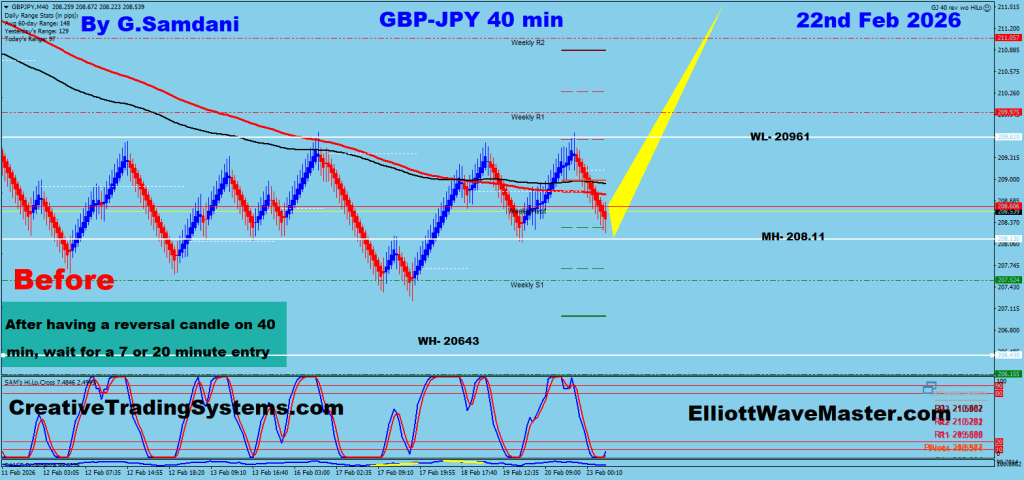
GBP-JPY ” Before “. 02-22-26.
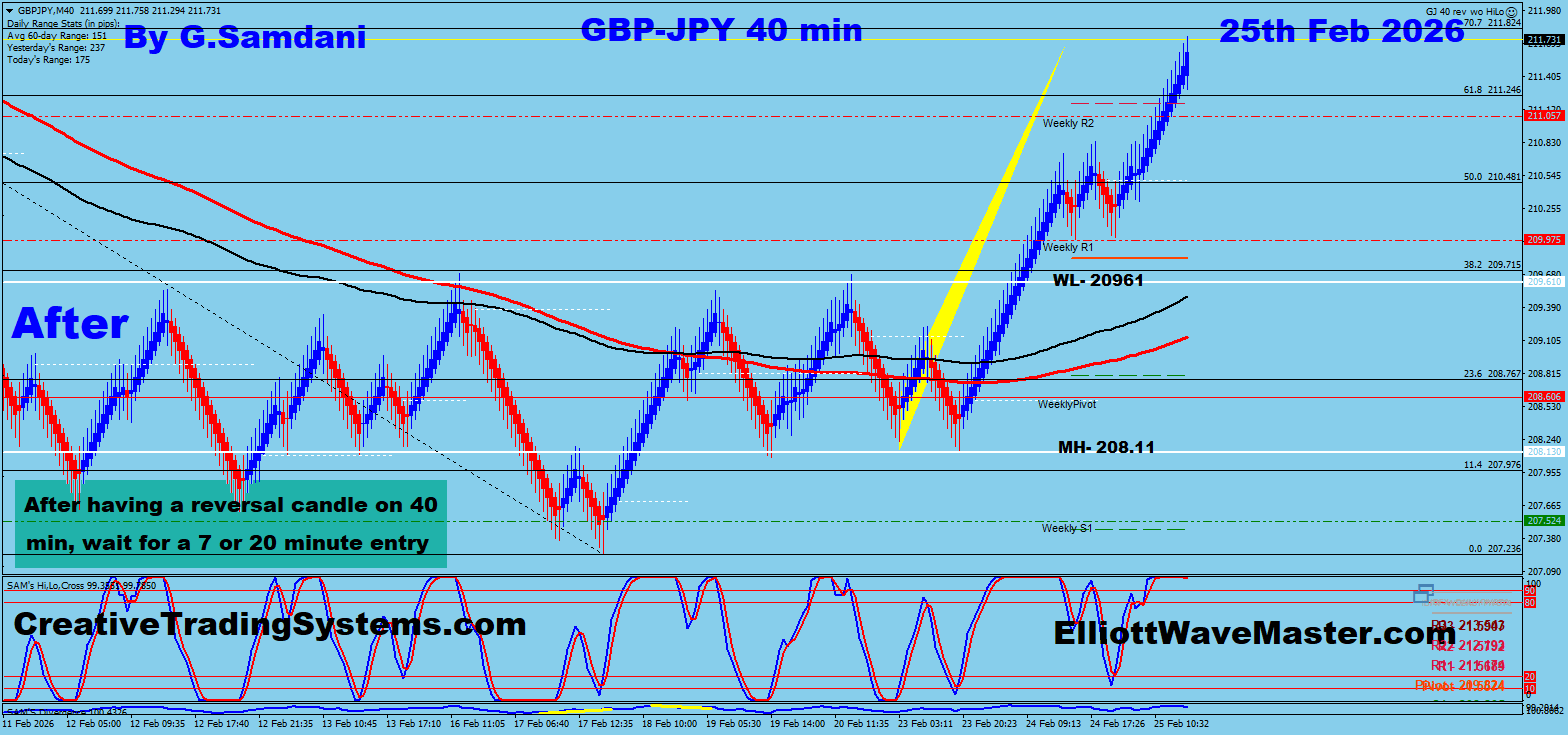
GBP-JPY ” After ” 02-25-26.
JPY Index ” Before “. 02-12-26.

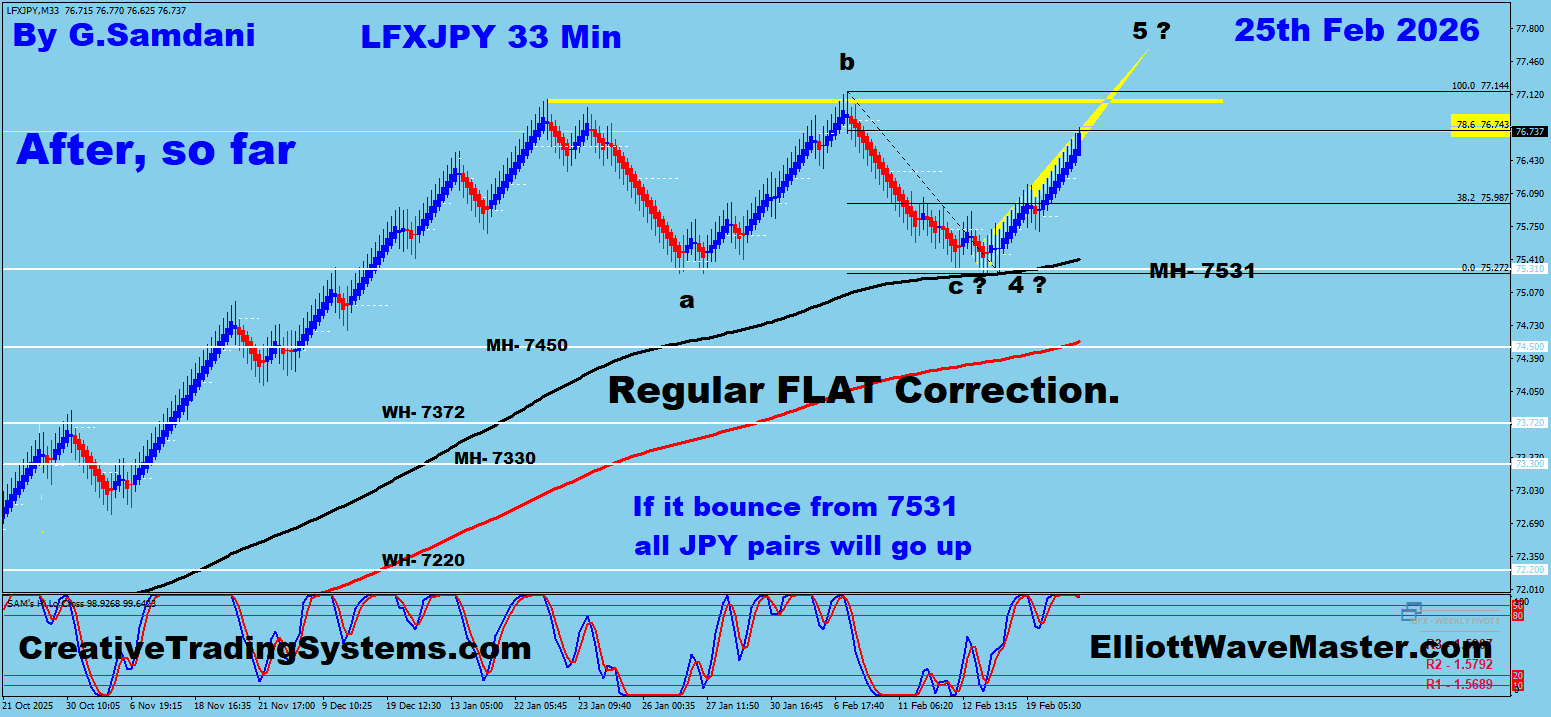
JPY Index ” After ” 02-25-26.
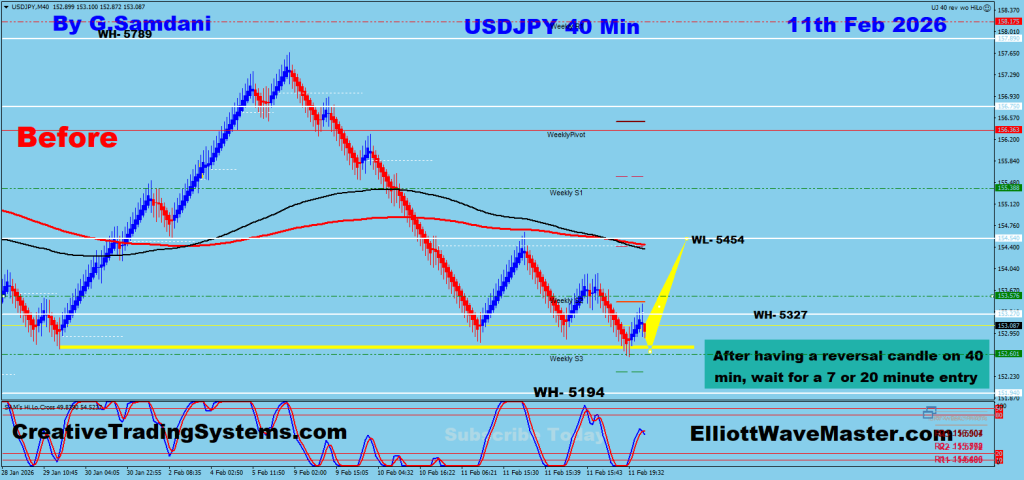
USDJPY ” Before “. 02-11-26.
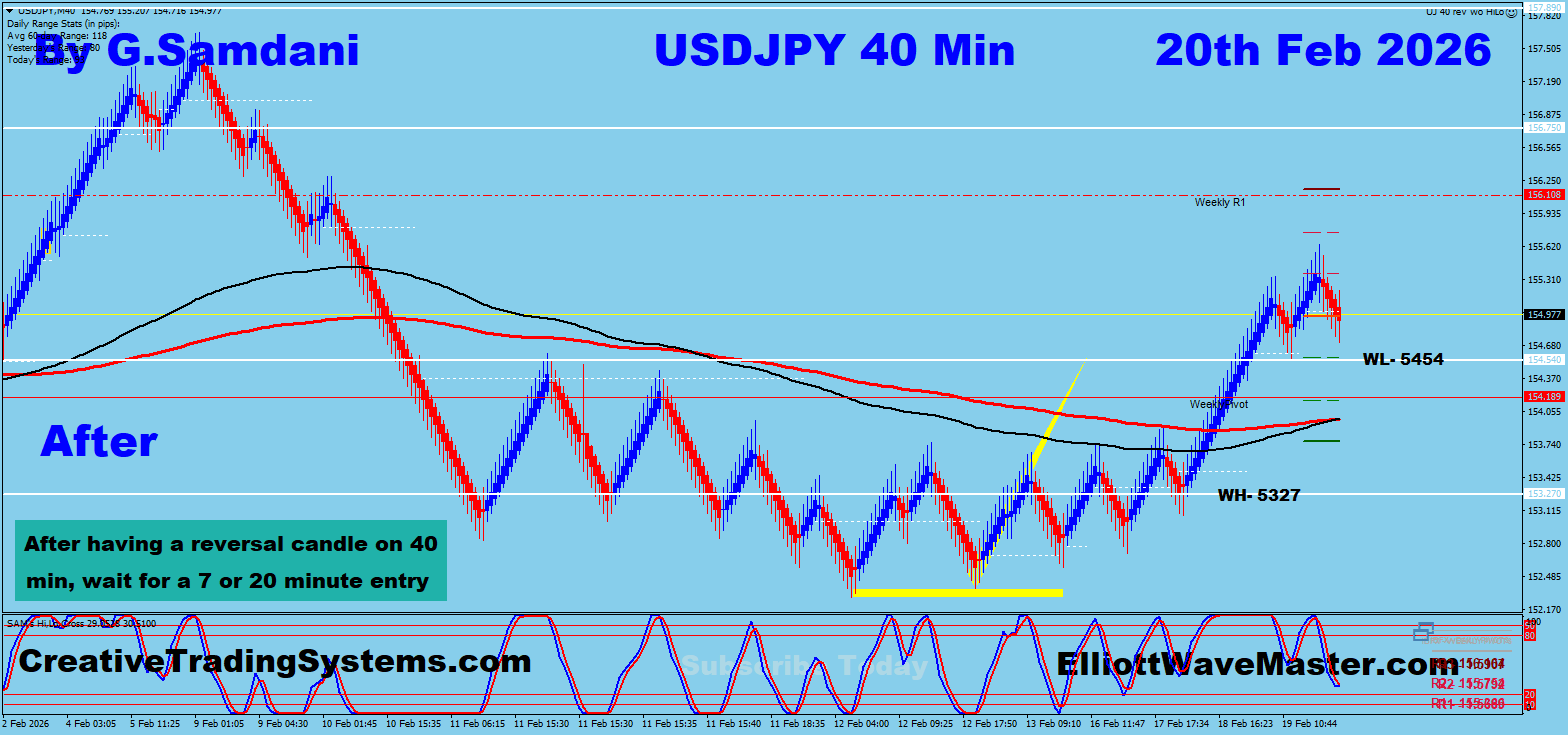
USDJPY. ” After ” 02-20-26.
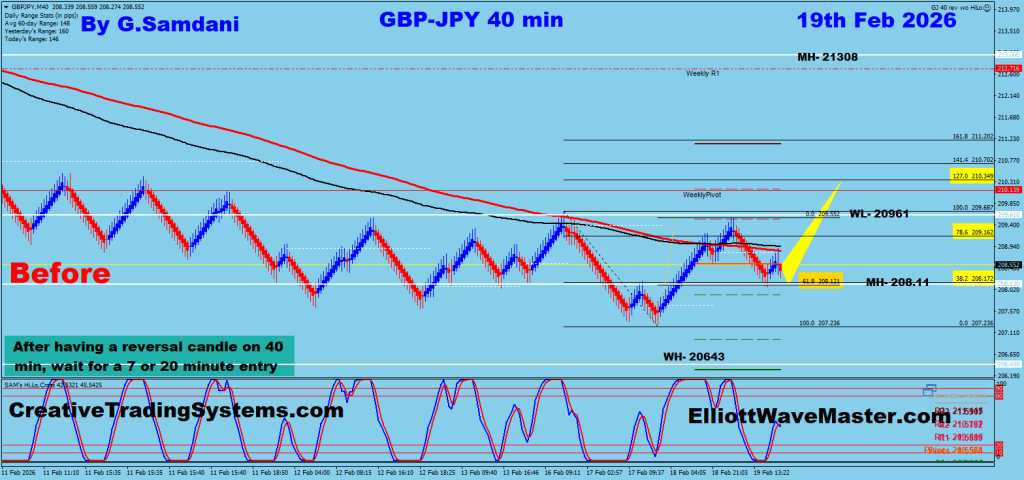
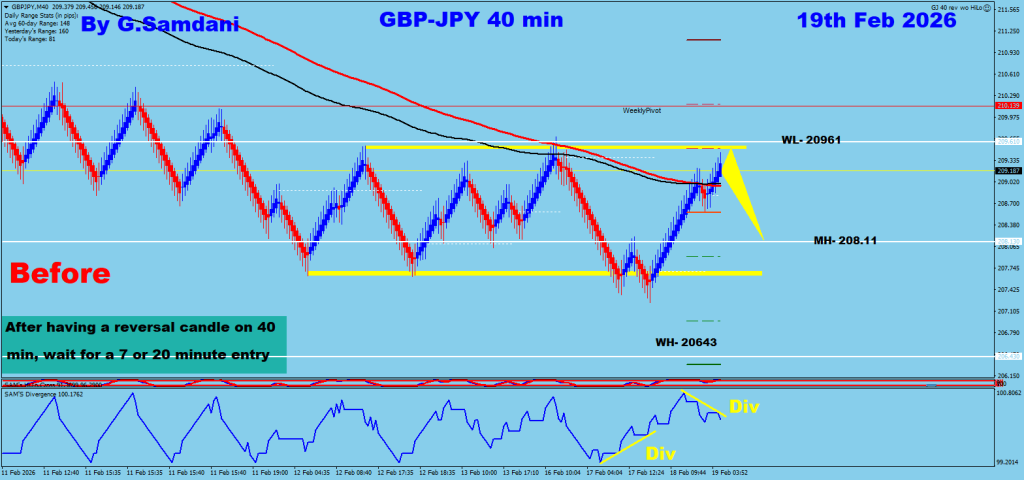
GBPJPY ” Before “. 02-19-26.
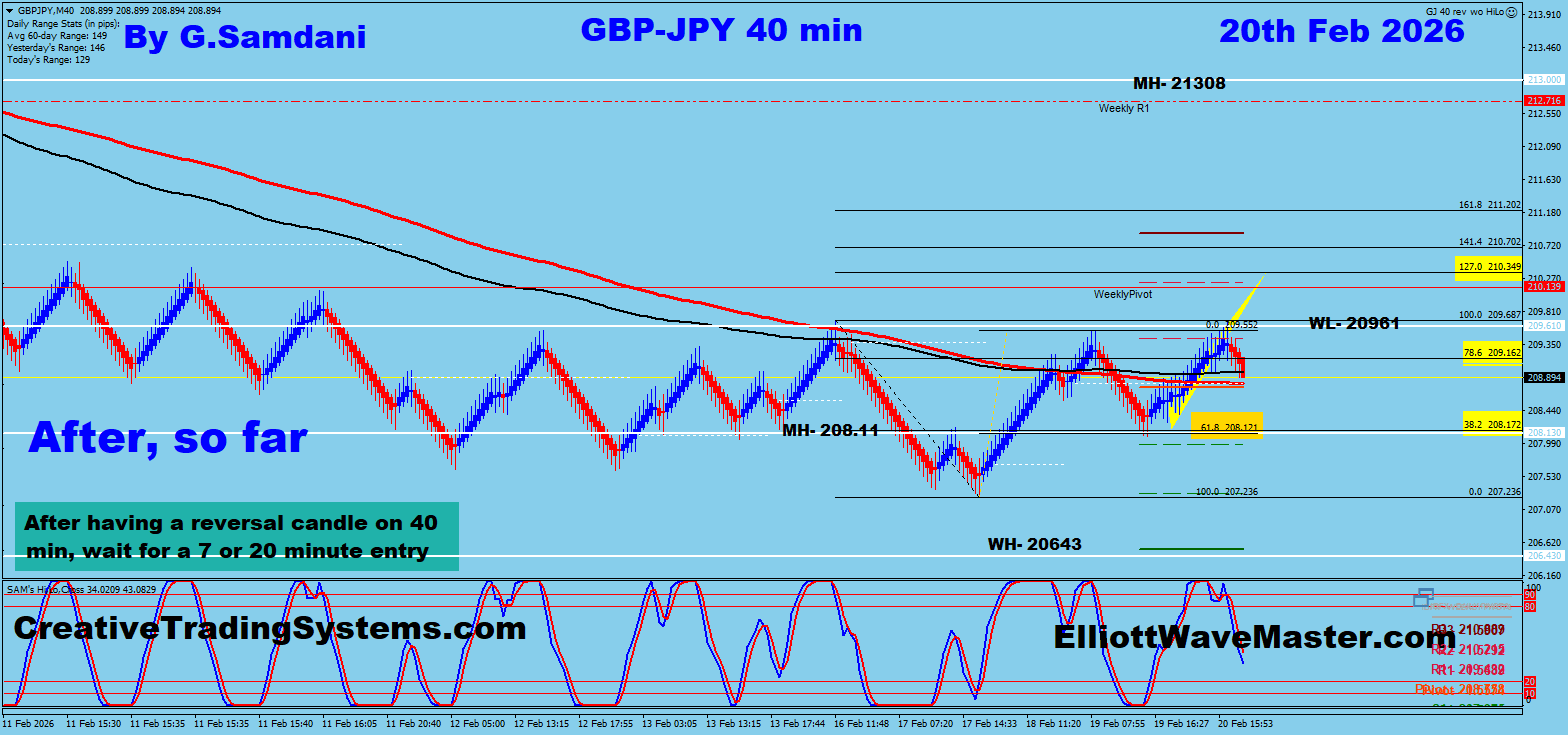
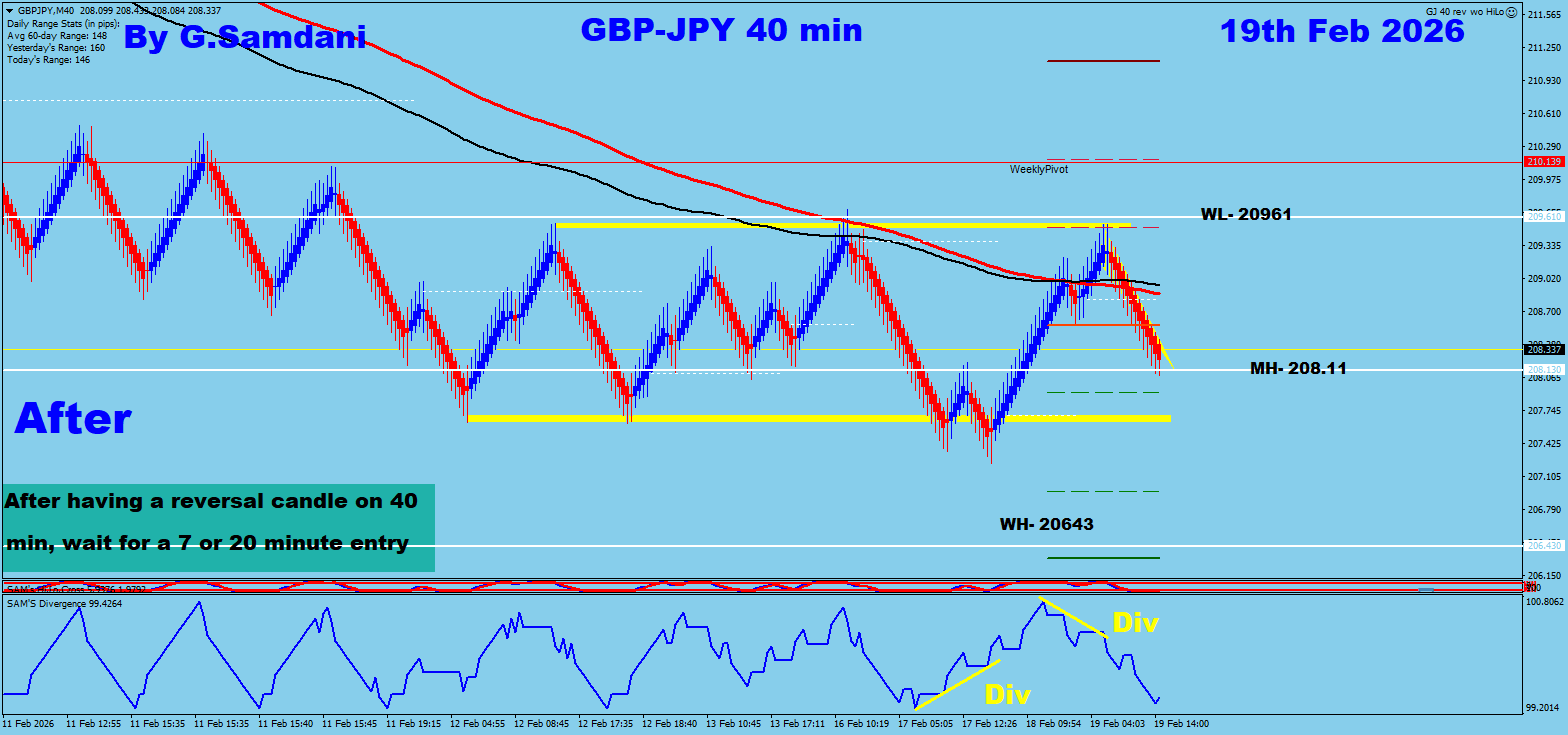
GBPJPY. ” After ” 02-20-26.
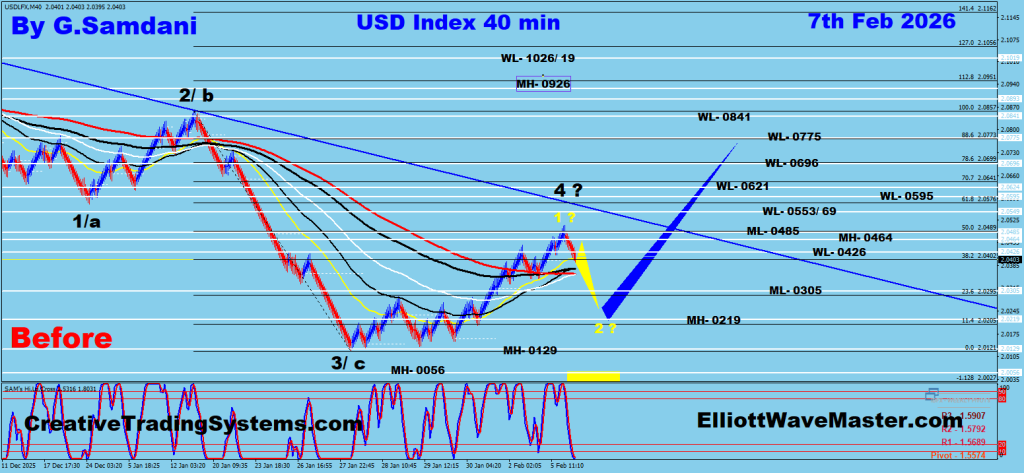
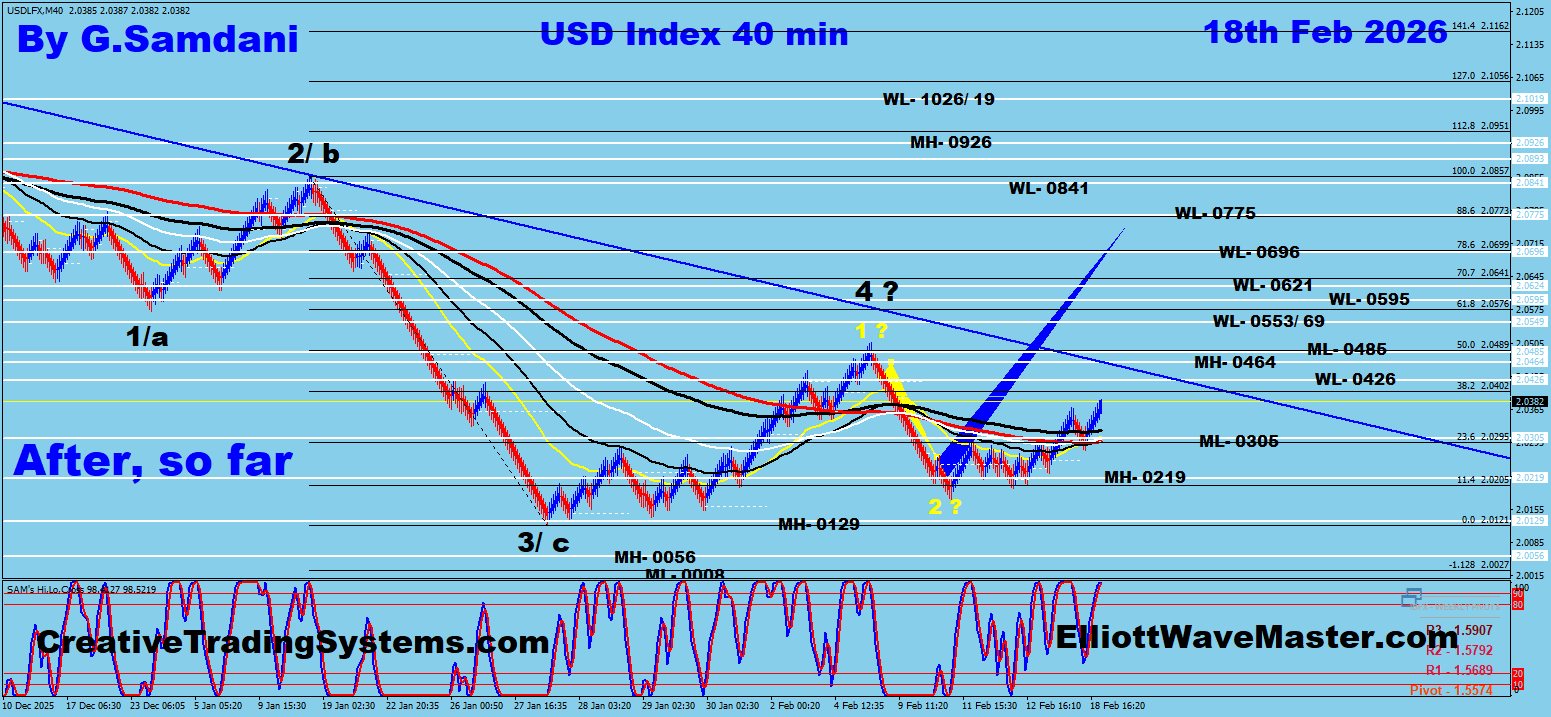
USD Index ” Before “. 02-07-26.
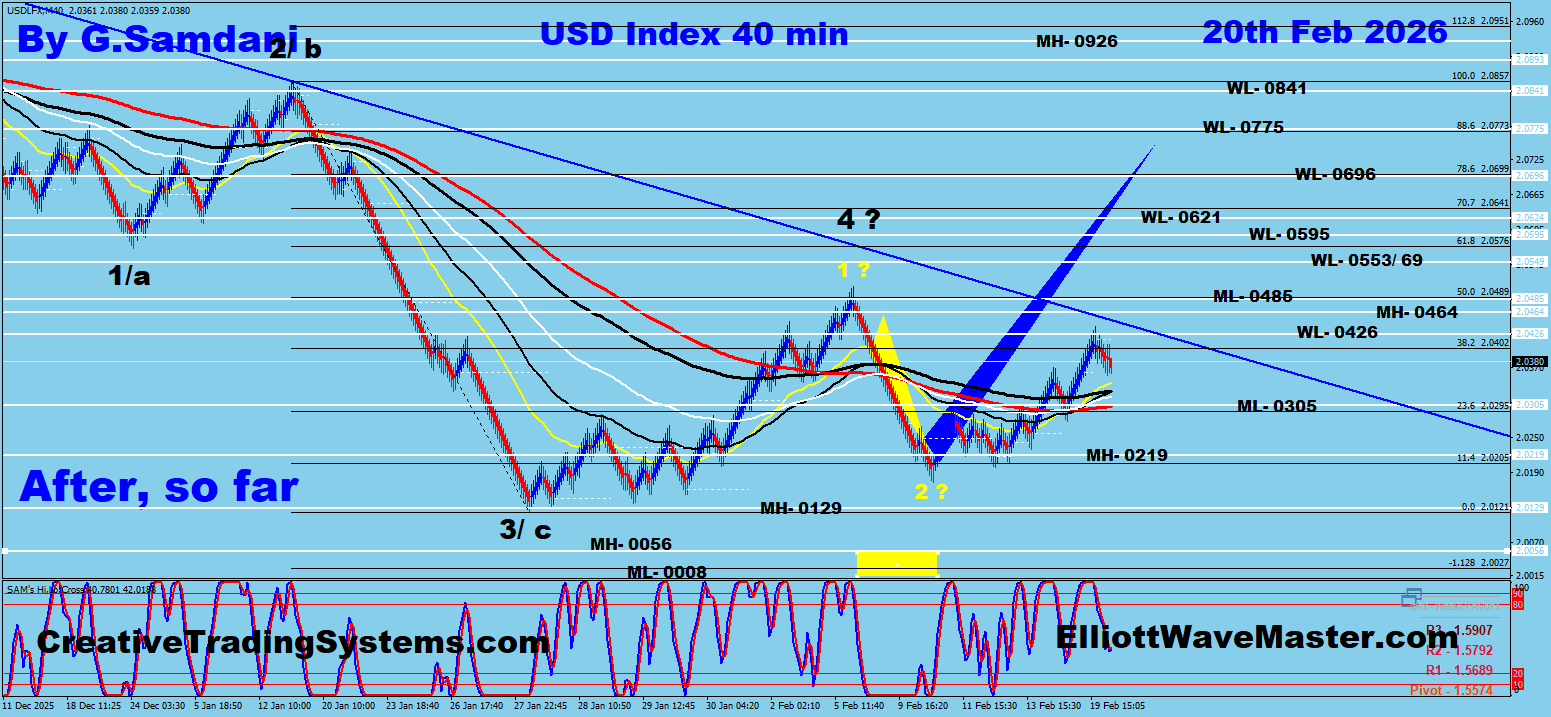
USD Index. ” After ” 02-20-26.
GBPJPY ” Before “. 02-19-26.
GBPJPY. ” After ” 02-19-26.
USD Index ” Before “. 02-07-26.
USD Index. ” After ” 02-13-26.
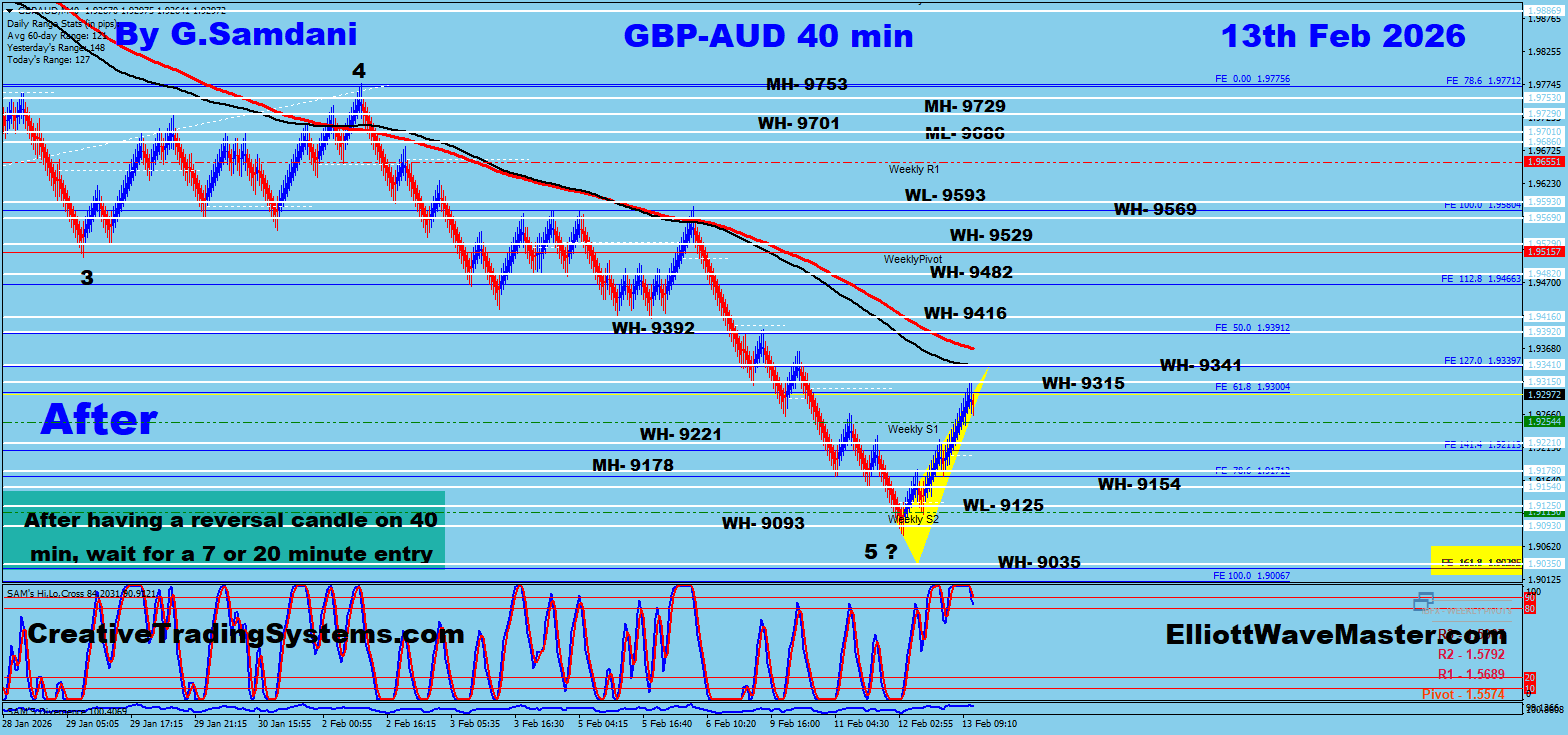
GBP-AUD ” Before “. 02-11-26.

GBP-AUD. ” After ” 02-13-26.
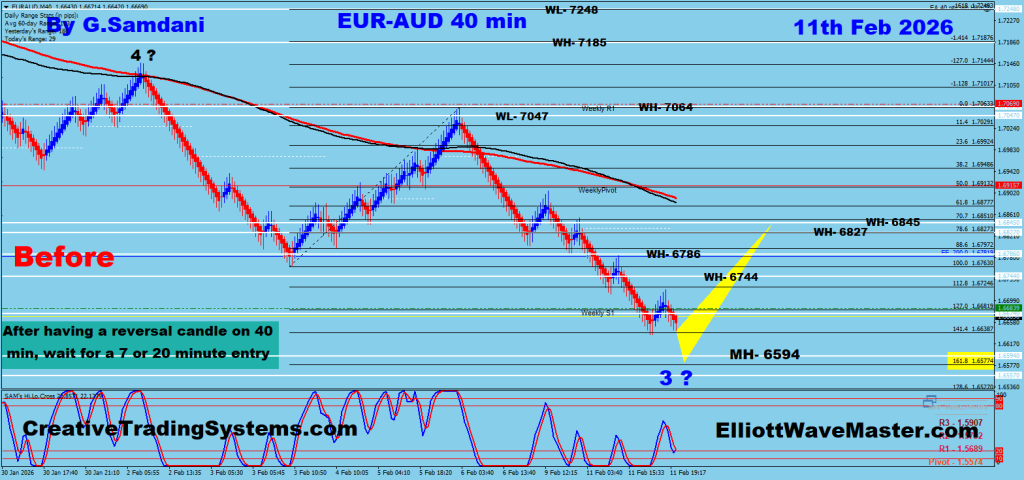
EUR-AUD ” Before “. 02-11-26.
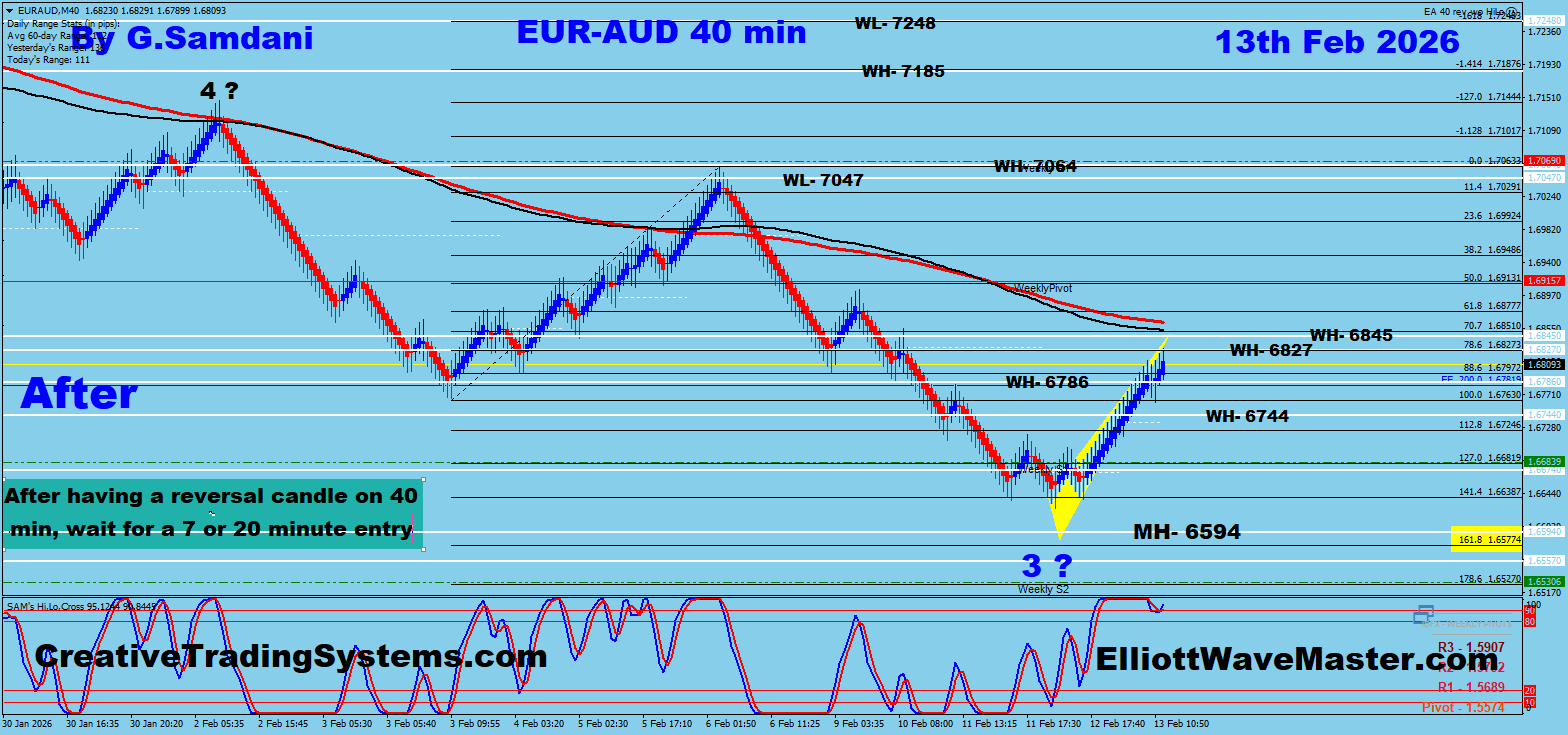
EUR-AUD. ” After ” 02-13-26.
EUR-JPY ” Before “. 02-07-26.

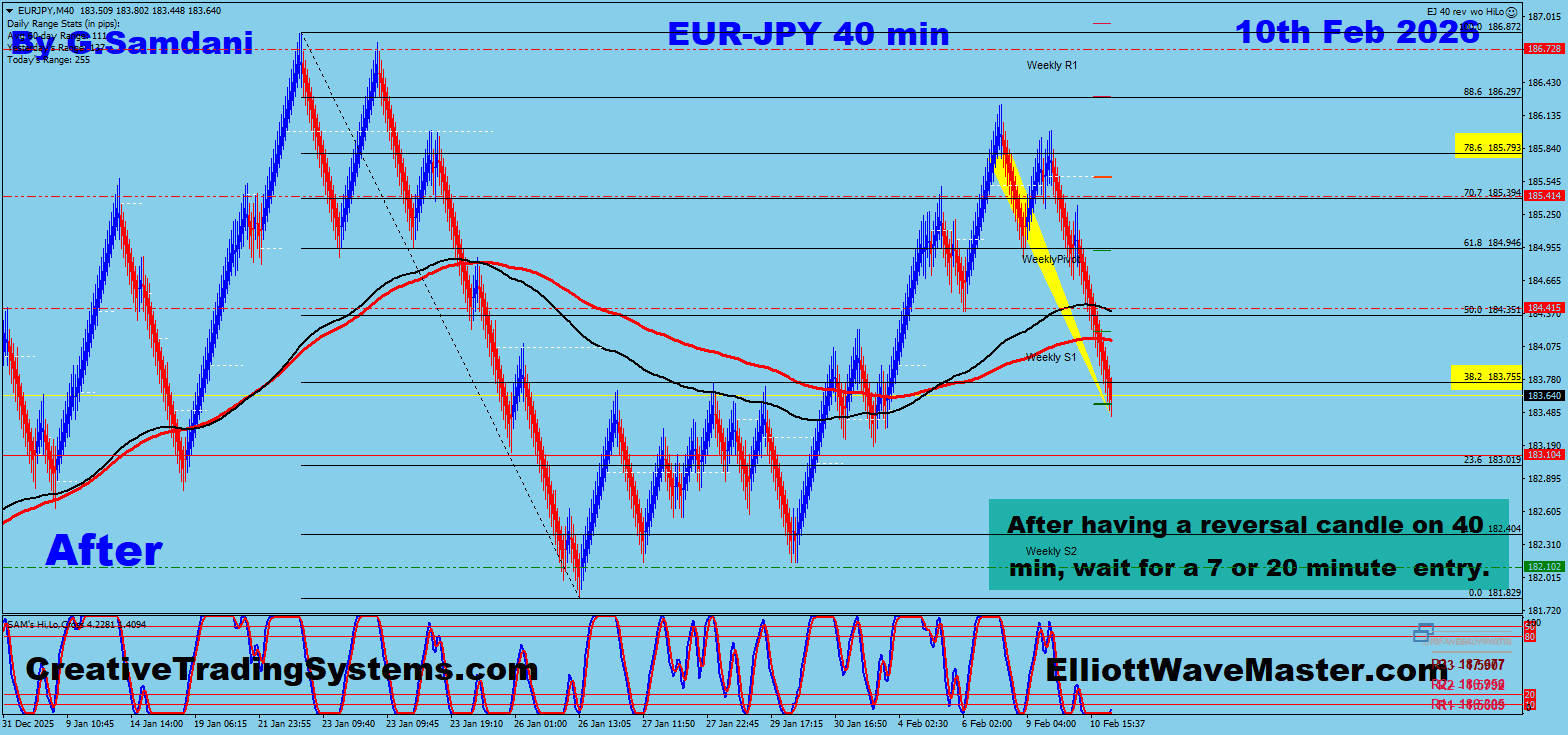
EUR-JPY. ” After ” 02-10-26.
GBPJPY ” Before “. 02-07-26.
GBPJPY. ” After ” 02-10-26.
USD-JPY ” Before “. 02-07-26.
USD-JPY. ” After ” 02-10-26.
USD-CAD ” Before “. 02-06-26.

USD-CAD. ” After ” 02-09-26.

GBP-USD ” Before “. 02-05-26.
GBP-USD. ” After ” 02-09-26.

EUR-AUD ” Before “. 02-05-26.
EUR-AUD. ” After ” 02-06-26.

Bitcoin ” Before “. 08-23-26.
Bitcoin. ” After ” 02-05-26.
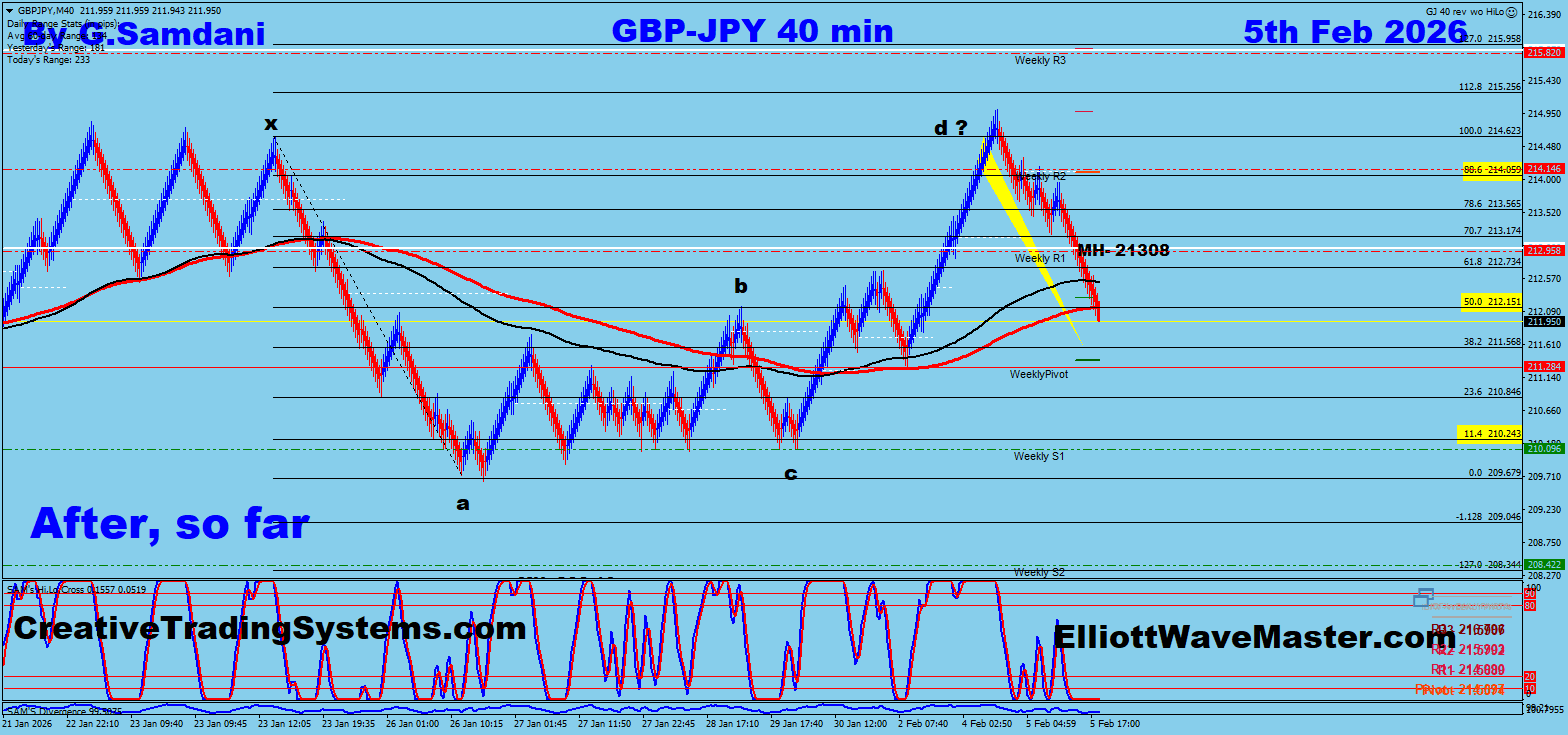
GBPJPY ” Before “. 02-03-26.
GBPJPY. ” After ” 02-05-26.
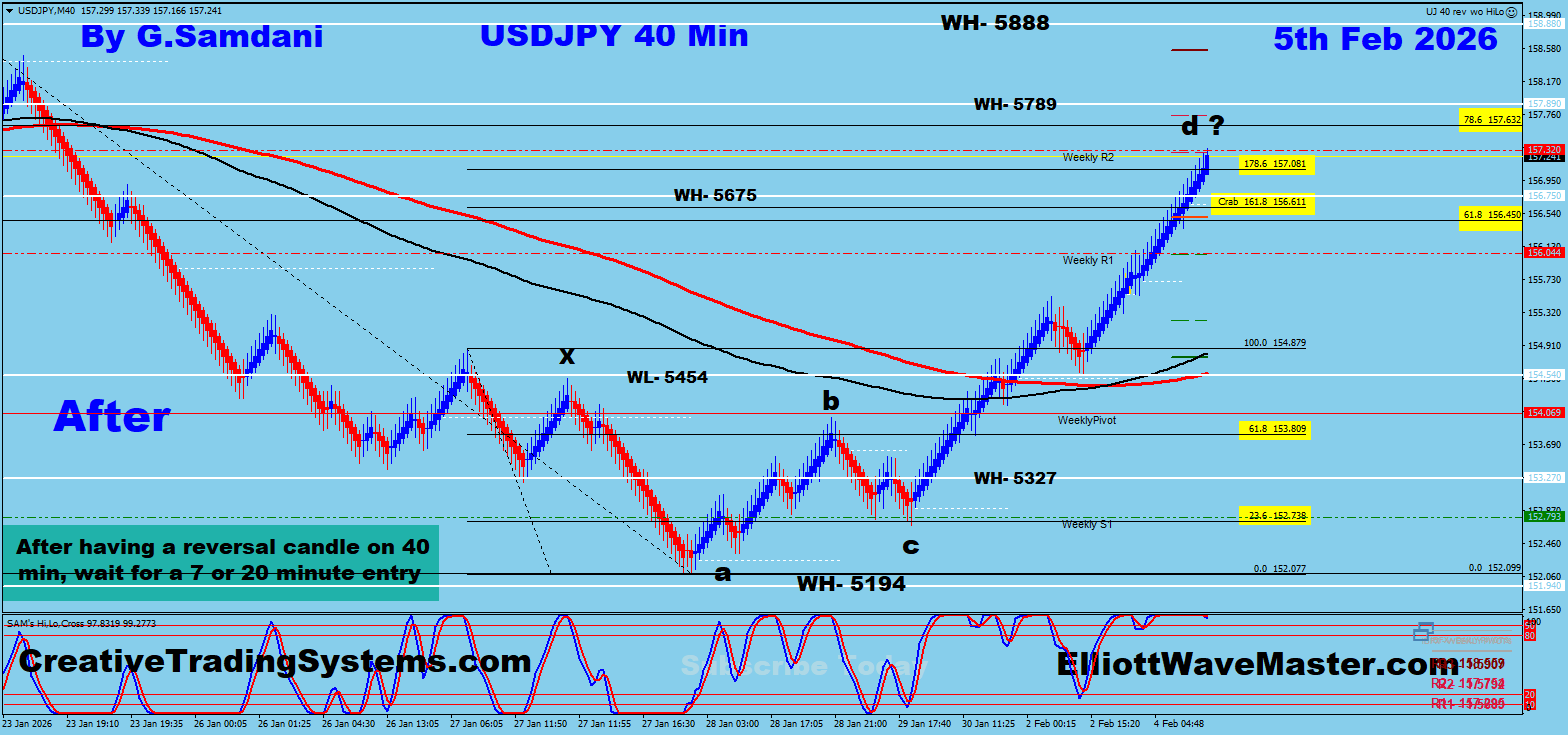
USDJPY ” Before “. 01-31-26.

USDJPY. ” After ” 02-05-26.
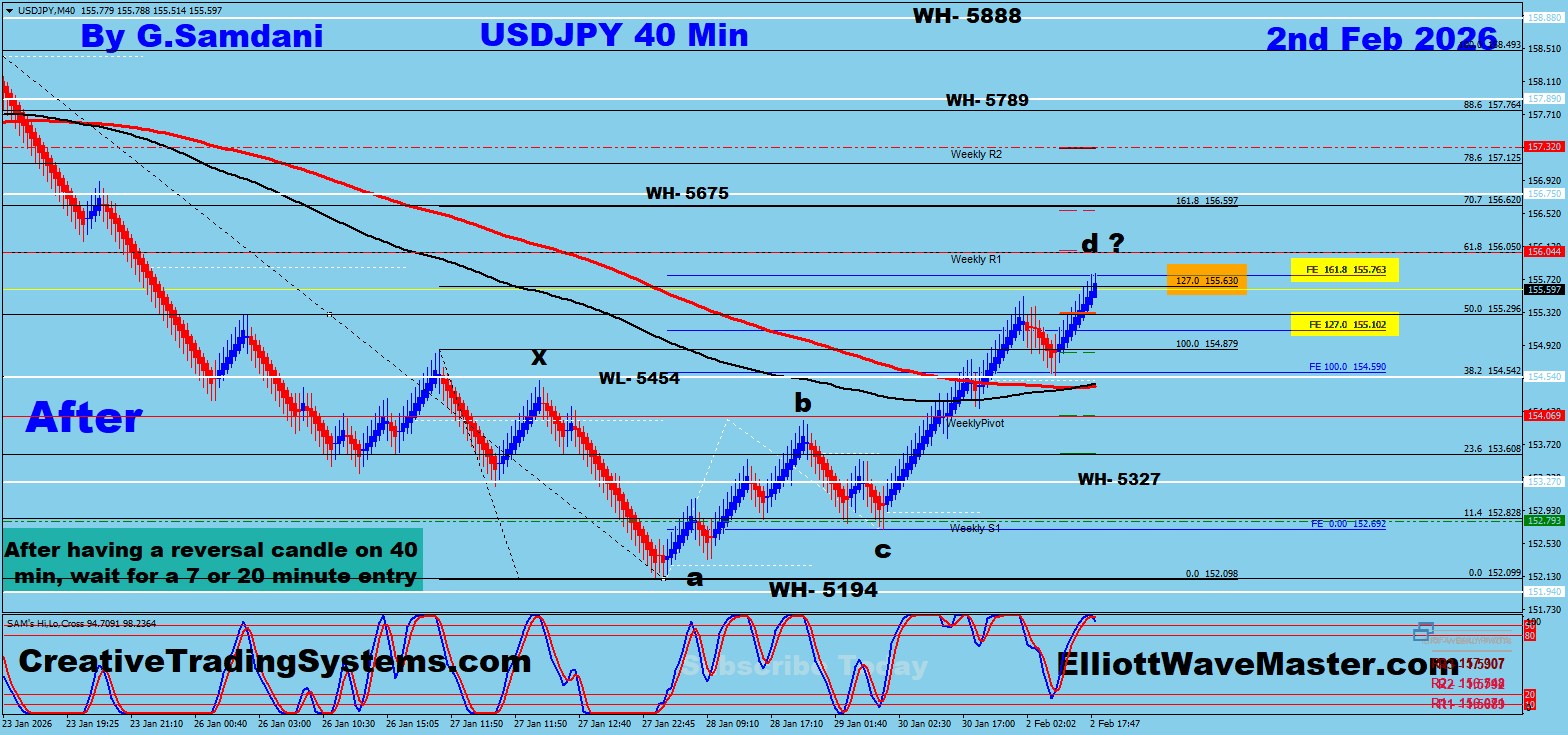
USDJPY ” Before “. 01-31-26.
USDJPY. ” After ” 02-02-26.
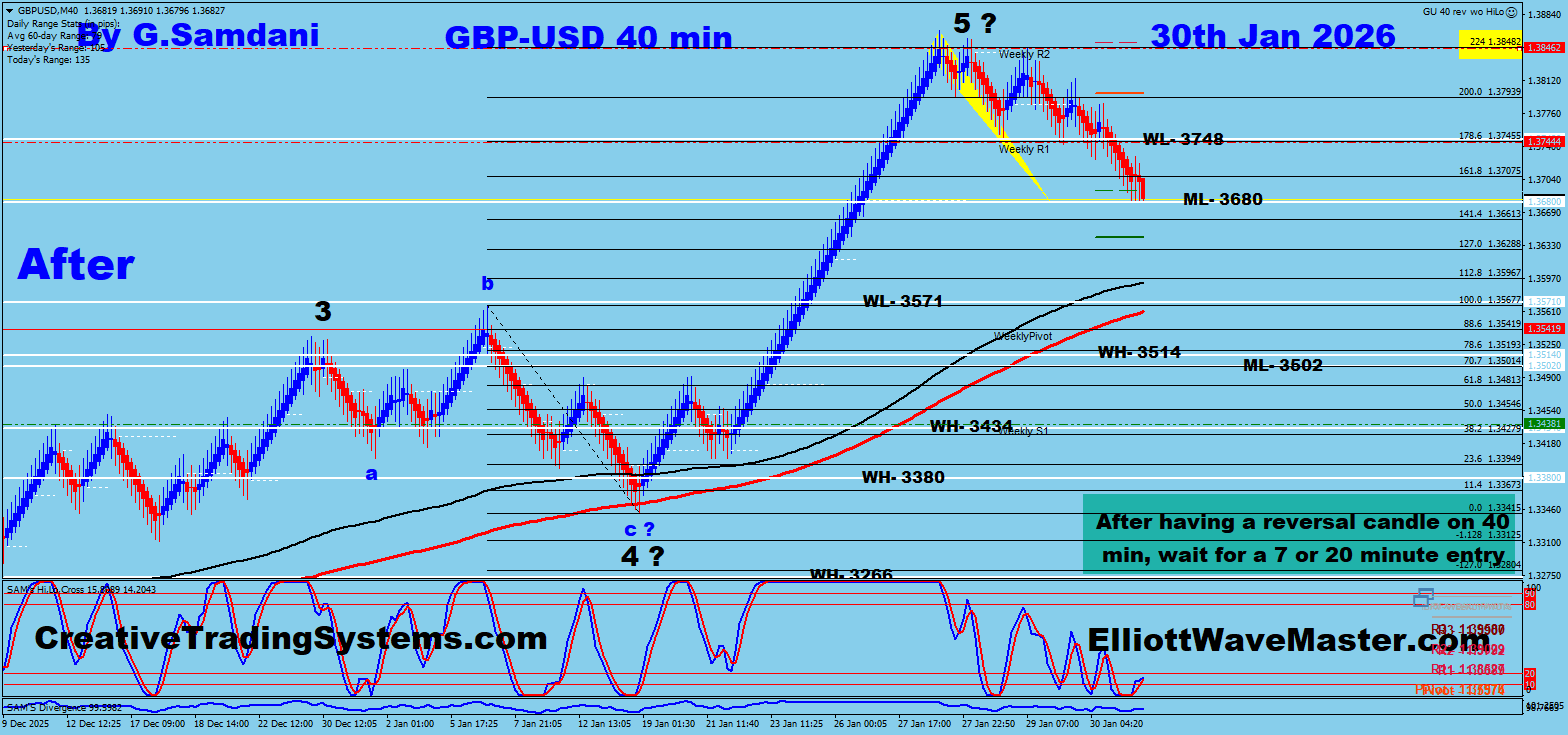
GBP-USD ” Before “. 01-27-26.

GBP-USD. ” After ” 01-30-26.
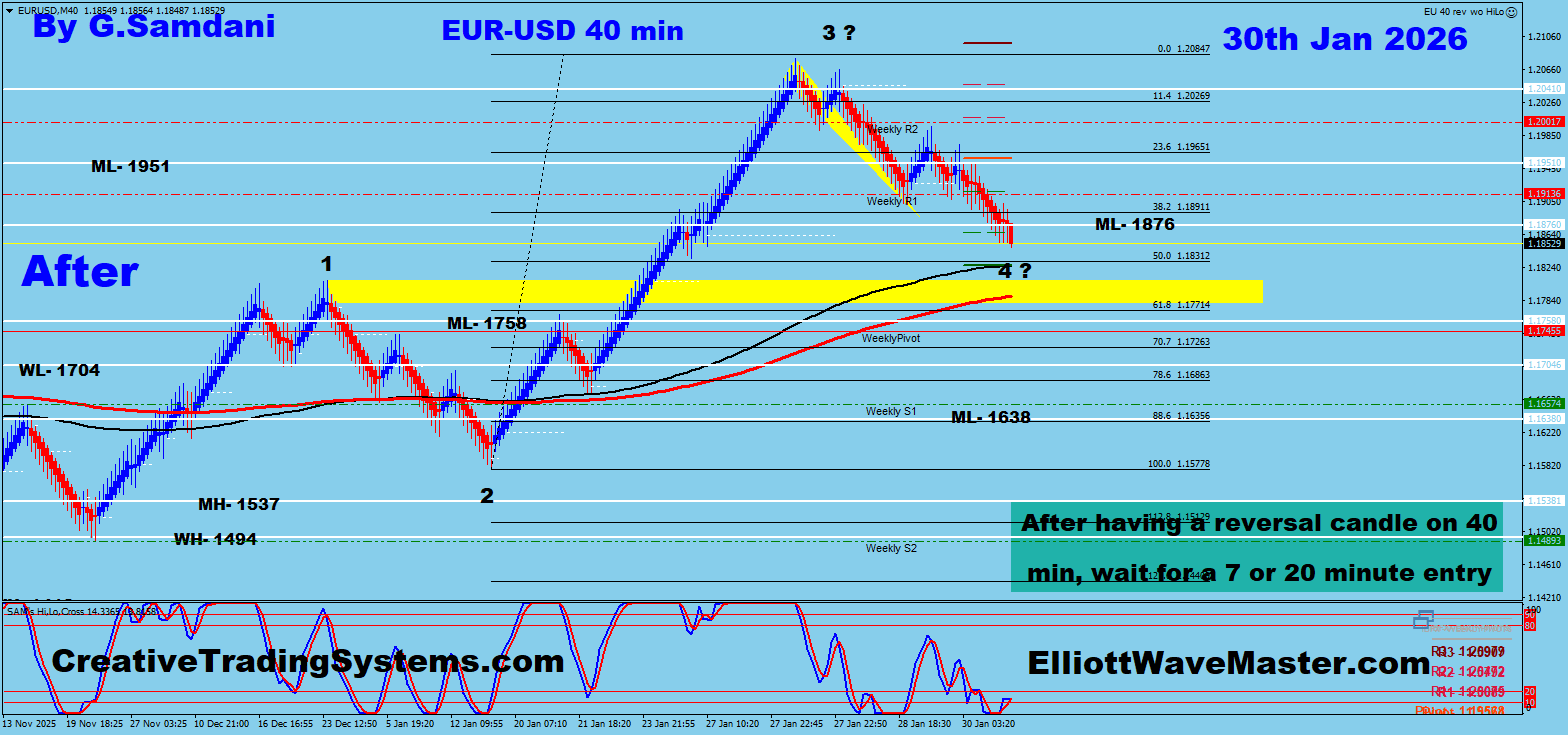
EUR-USD ” Before “. 01-27-26.

EUR-USD. ” After ” 01-30-26.
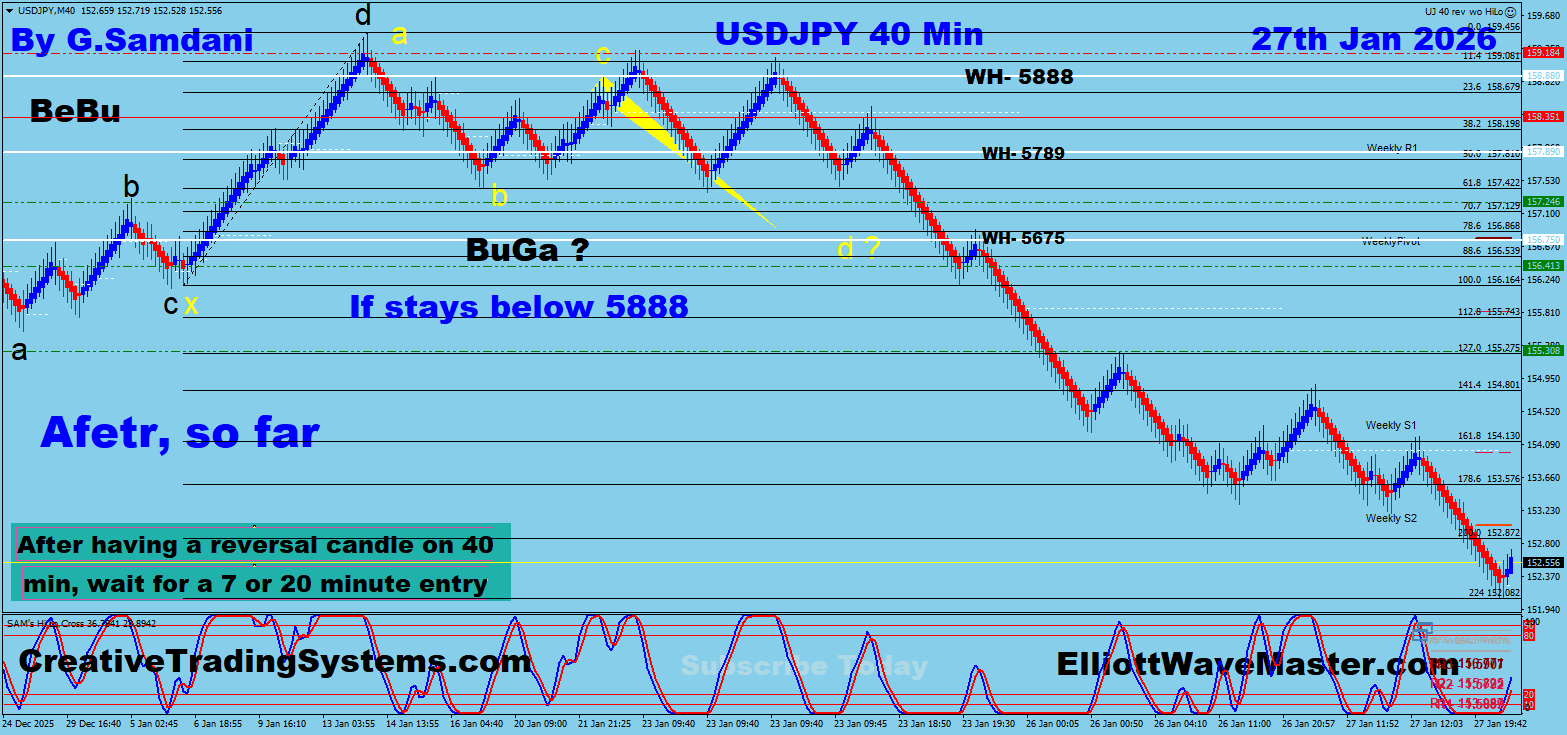
USD-JPY ” Before “. 01-22-26.
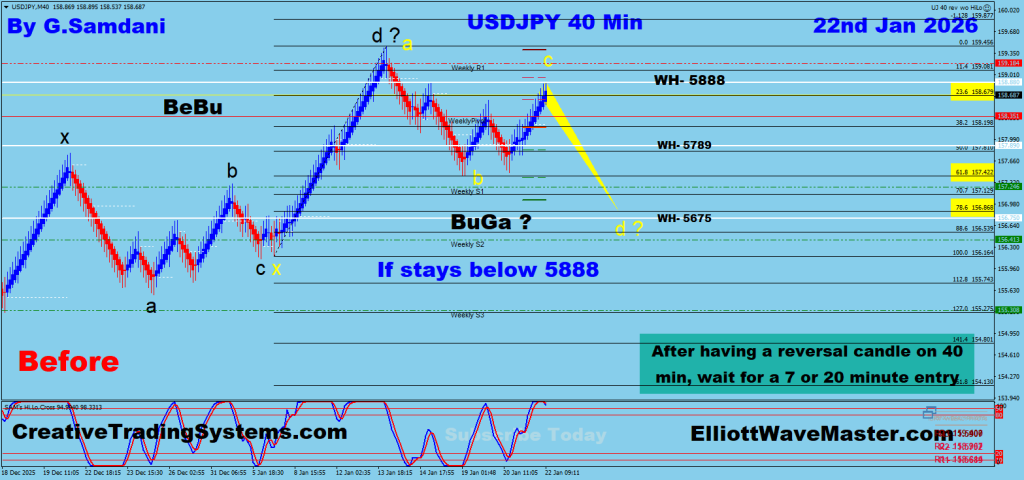
USD-JPY. ” After ” 01-27-26.
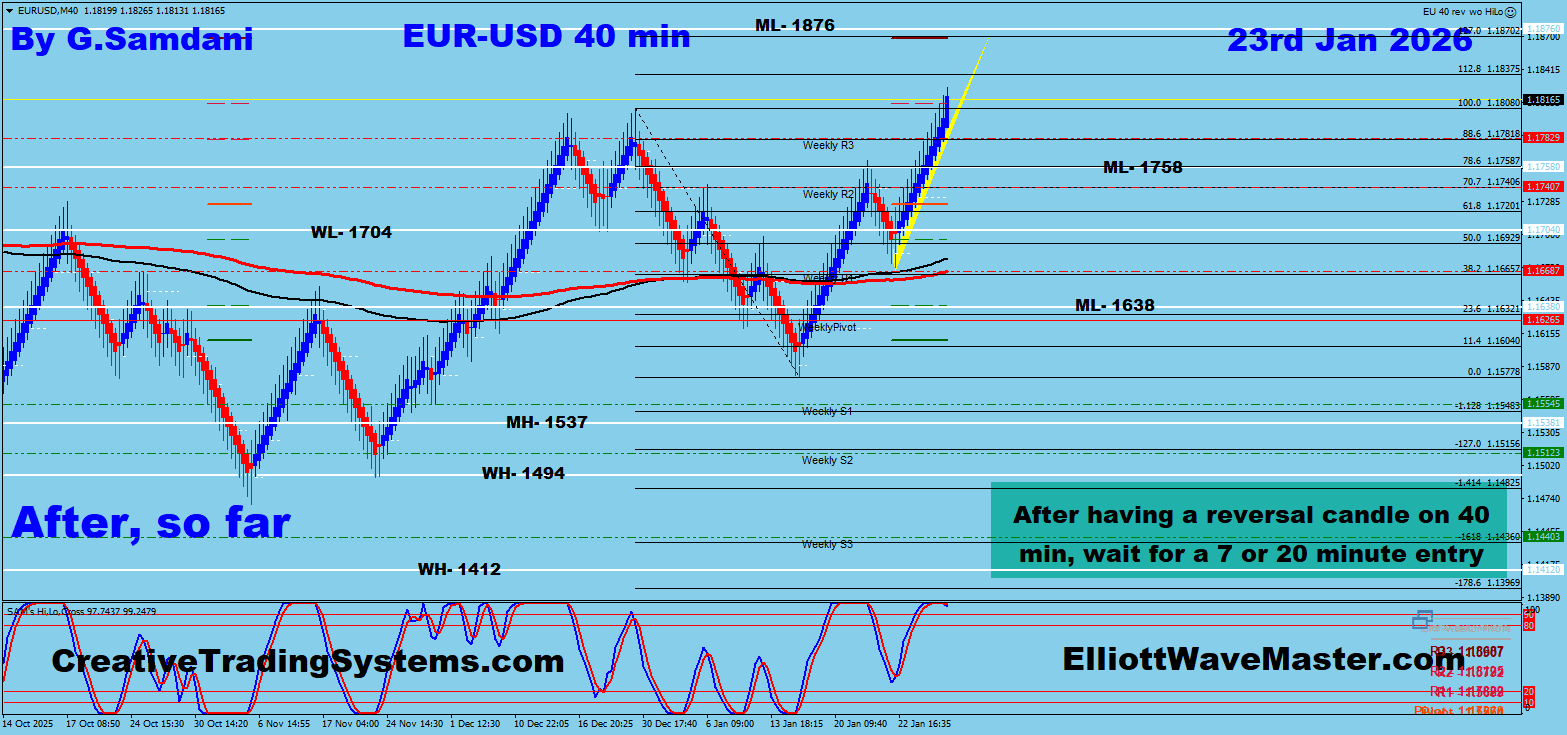
EUR-USD ” Before “. 01-22-25.
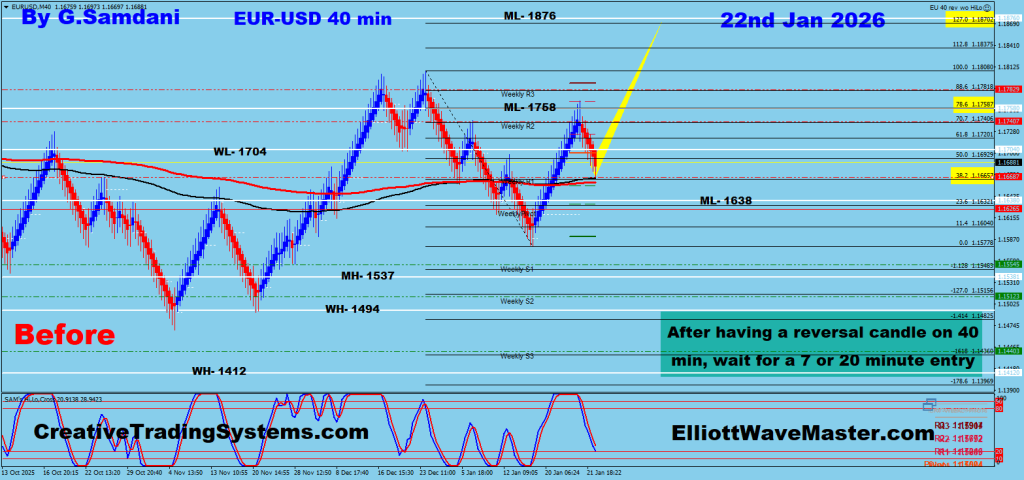
EUR-USD. ” After ” 01-23-26.
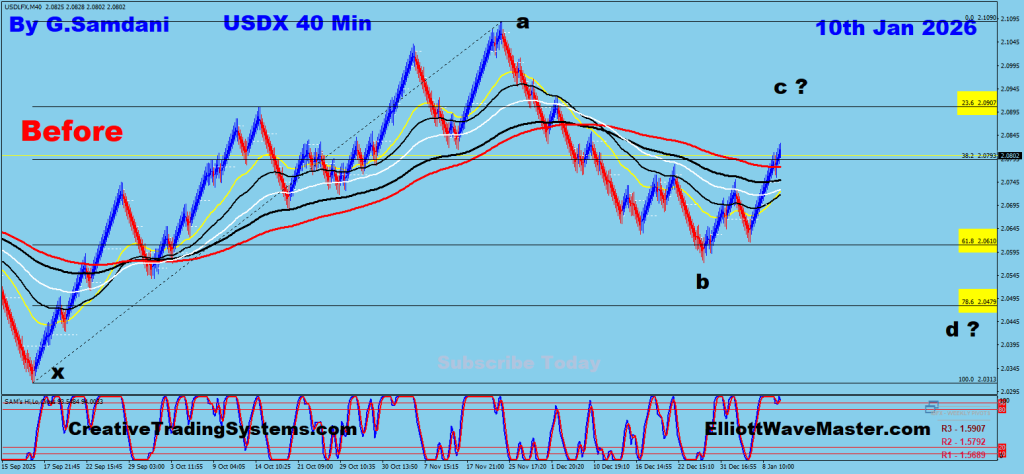
USD Index ” Before “. 01-10-26.
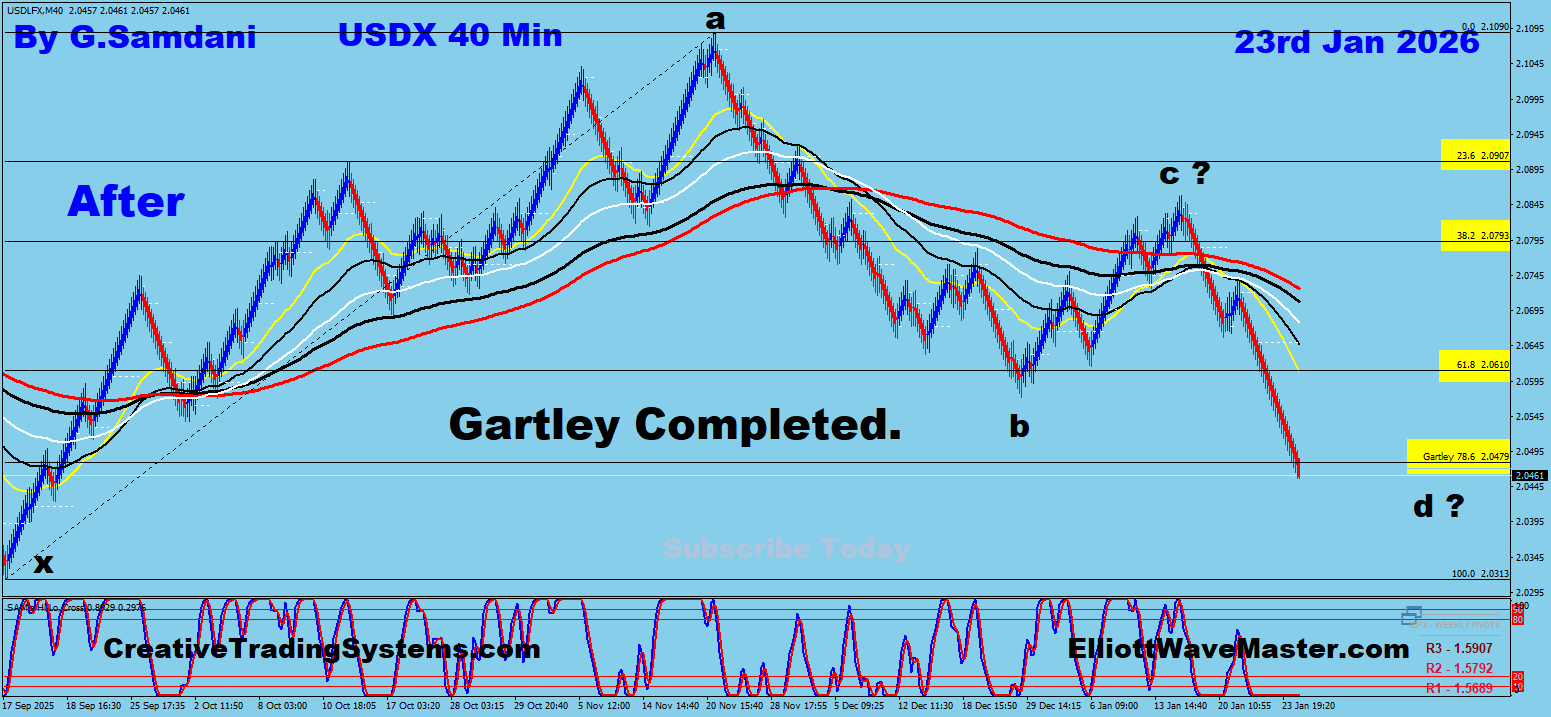
USD-JPY. ” After ” 01-23-26.
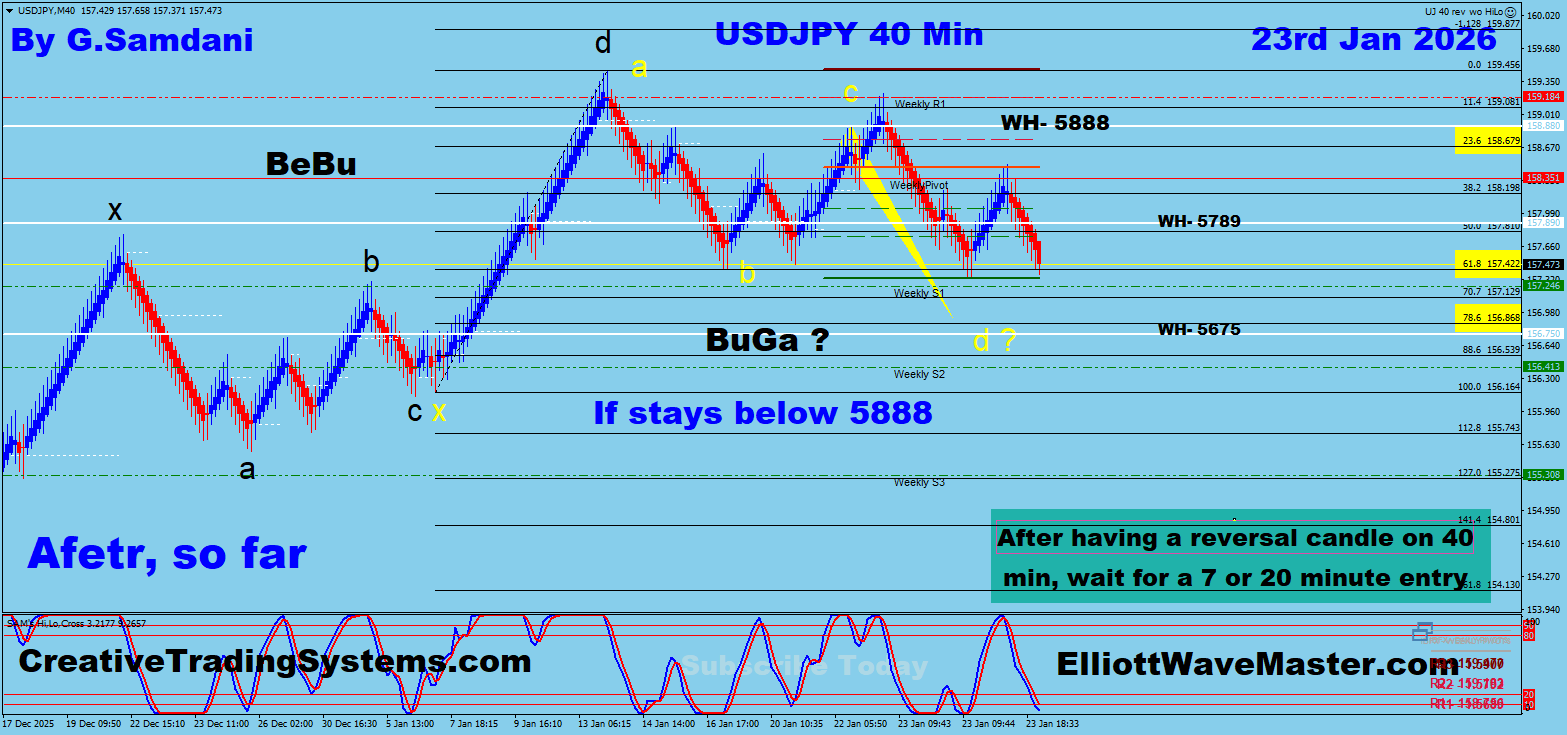
USD-JPY ” Before “. 01-22-26.
USD-JPY. ” After ” 01-23-26.
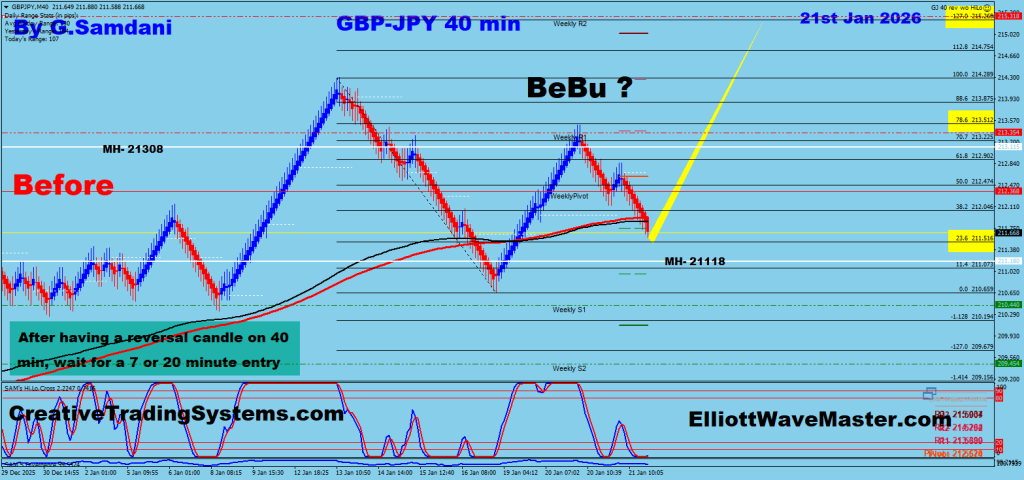
GBP-JPY ” Before “. 01-21-26.
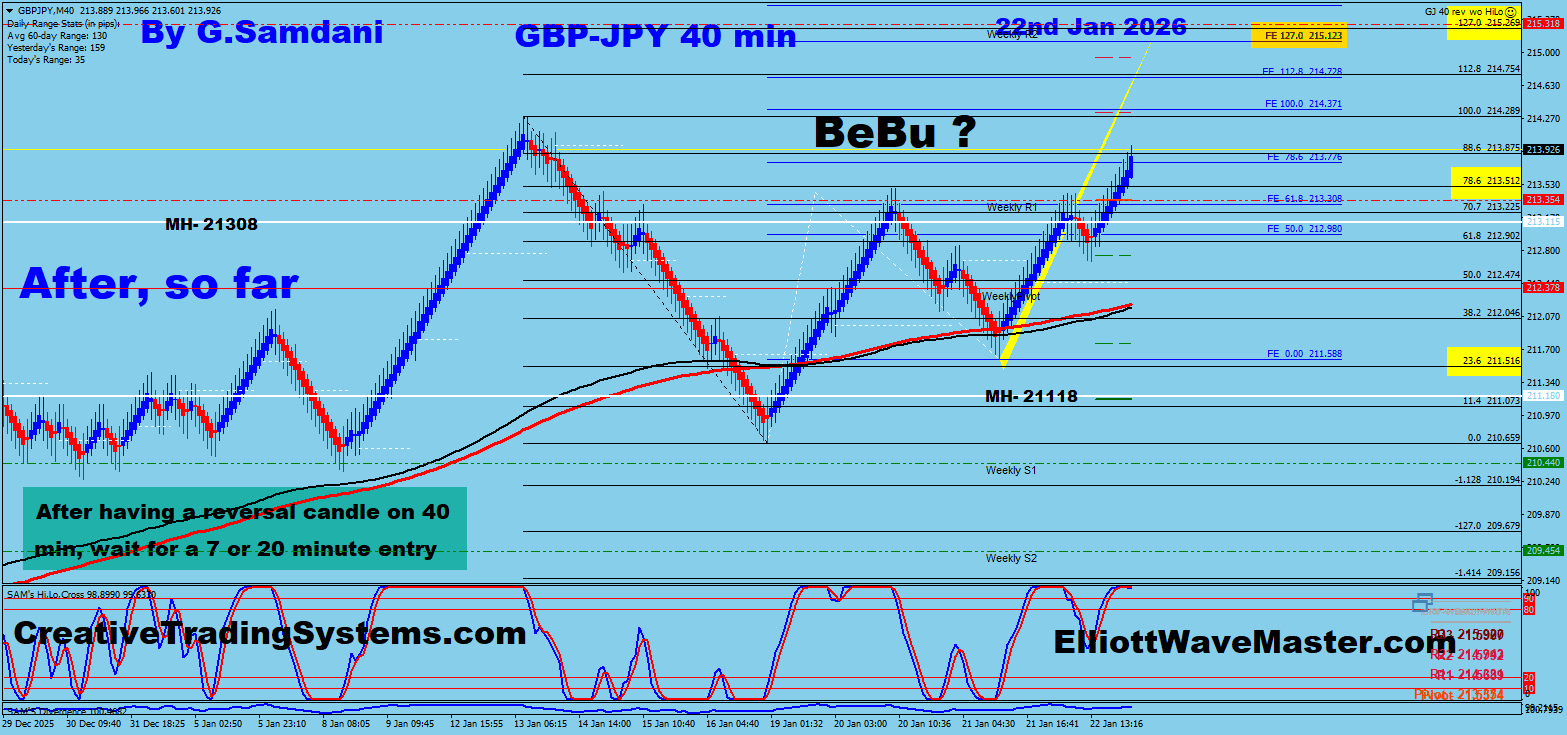
GBP-JPY. ” After ” 01-23-26.
USD-CAD ” Before “. 01-18-26.

USD-CAD. ” After ” 01-23-26.

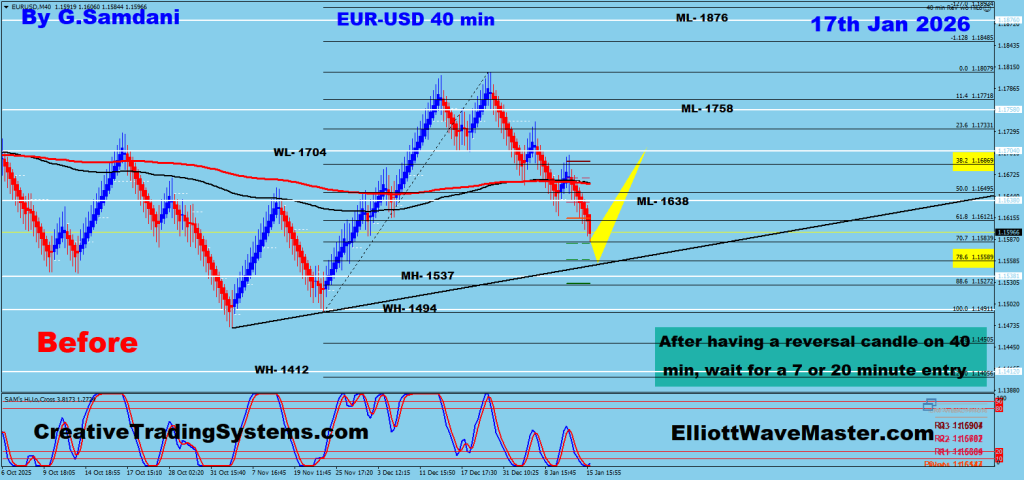
EUR-USD ” Before “. 01-17-26.
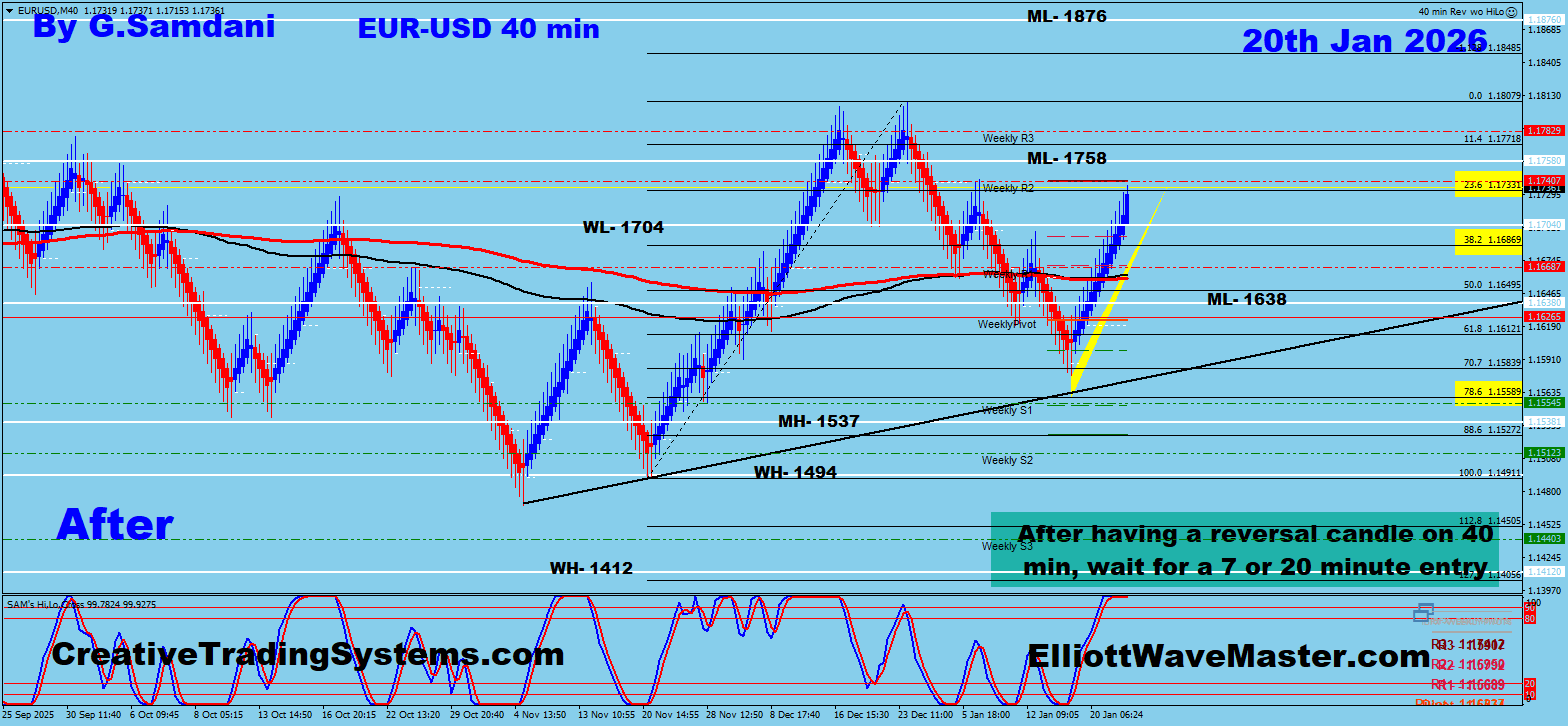
EUR-USD. ” After ” 01-20-26.
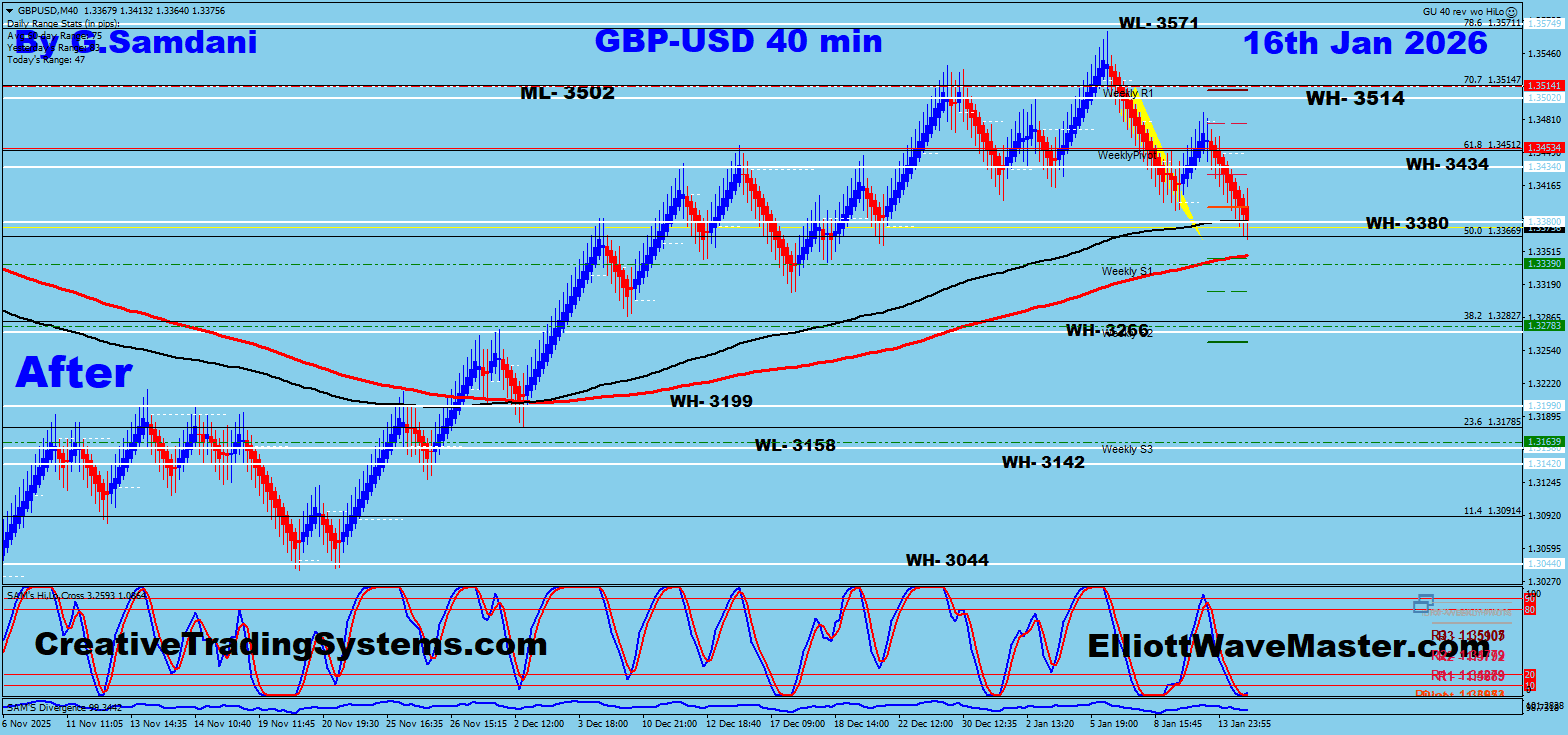
GBP-USD ” Before “. 01-06-26.

GBP-USD. ” After ” 01-16-26.
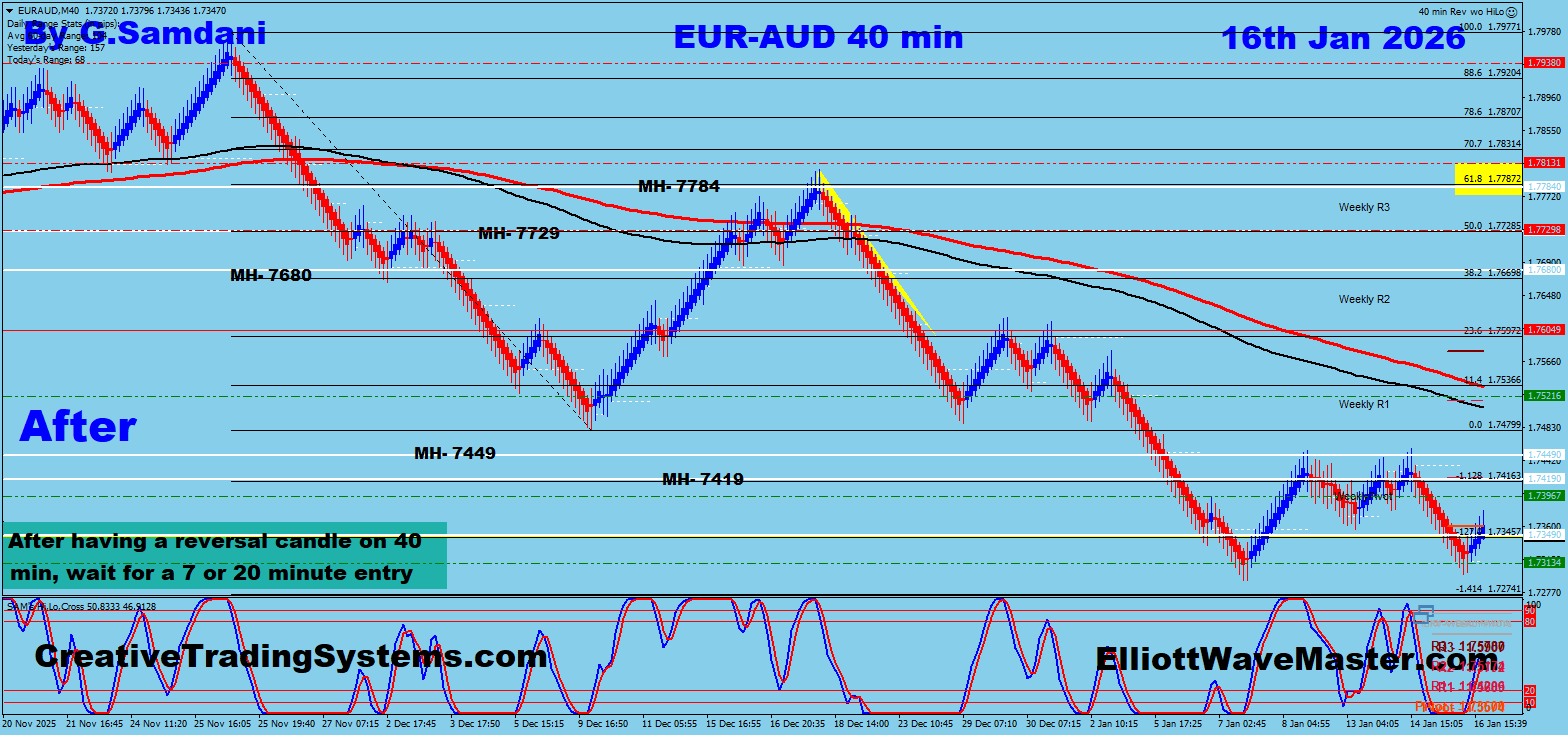
EUR-AUD ” Before “. 12-24-25.
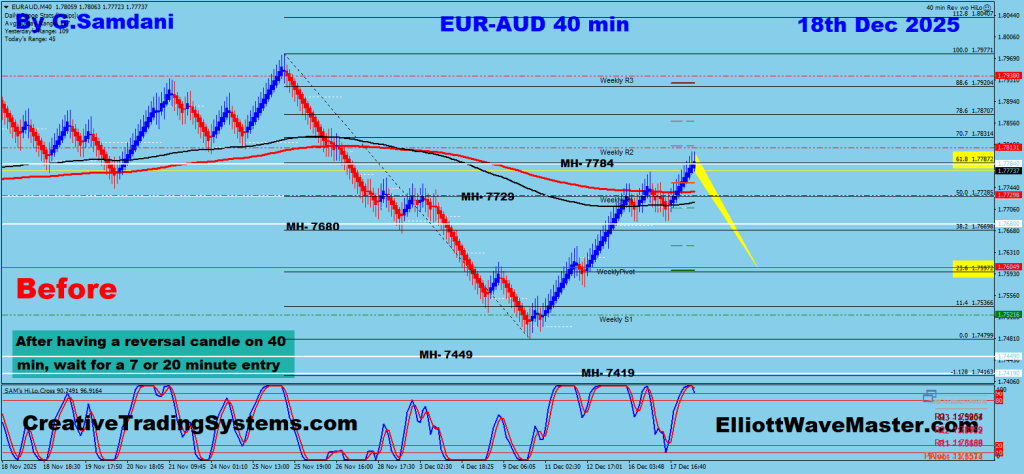
EUR-AUD. ” After ” 01-16-26.
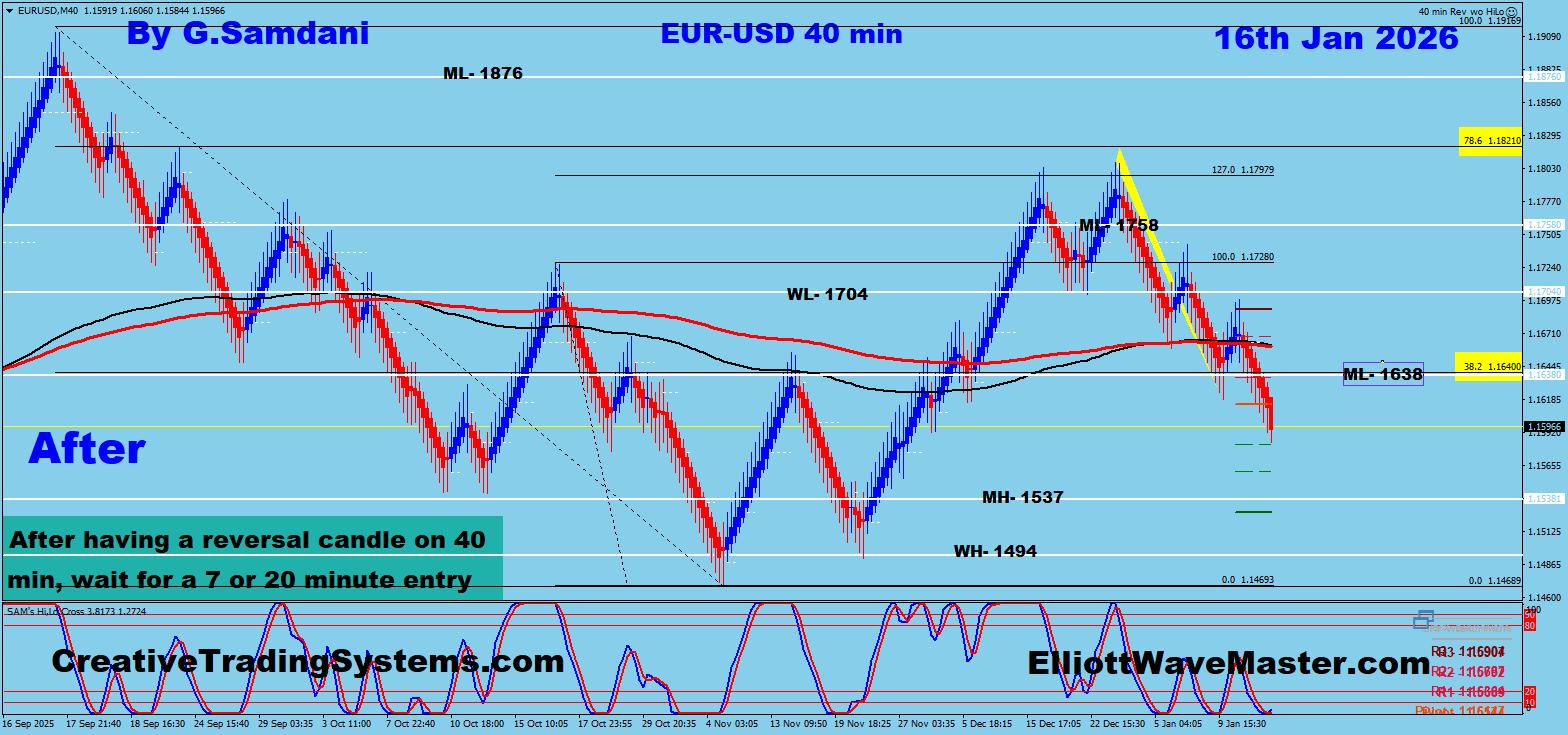
EUR-USD ” Before “. 12-24-25.
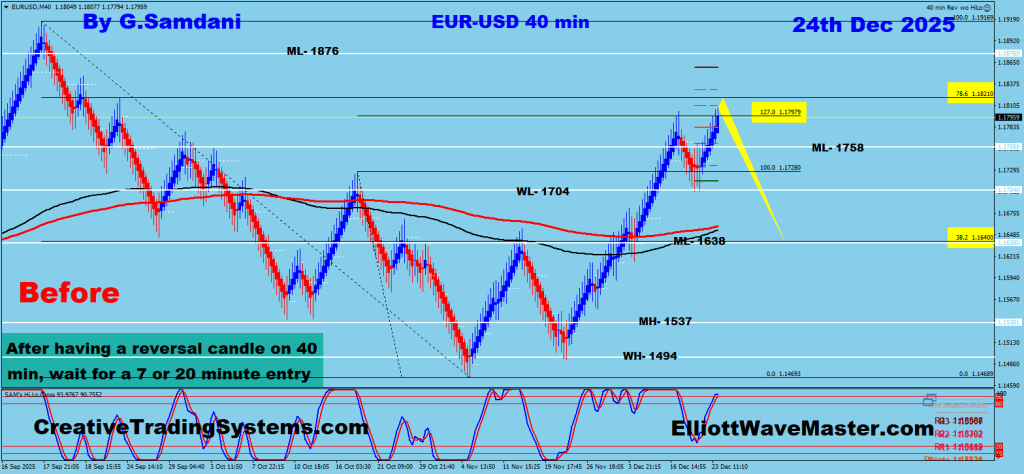
EUR-USD. ” After ” 01-16-26.
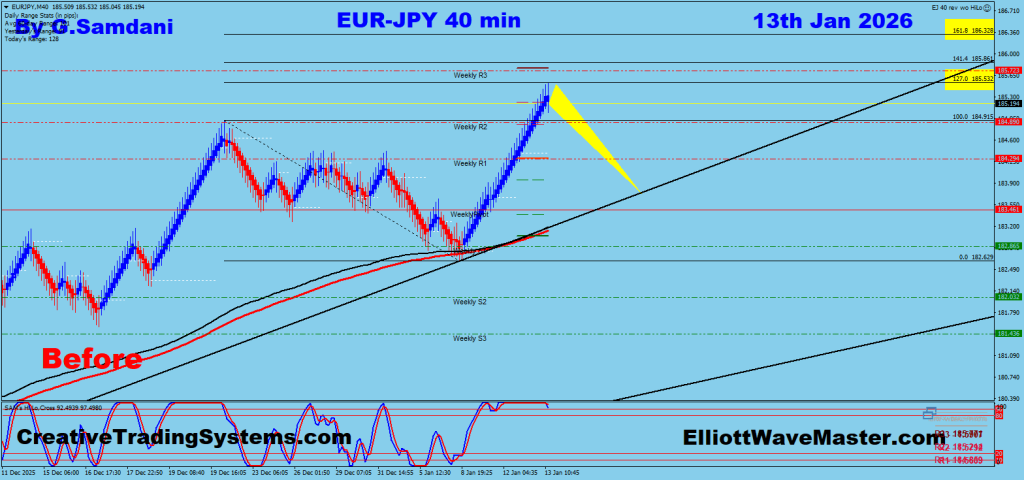
EUR-JPY ” Before “. 01-13-26.
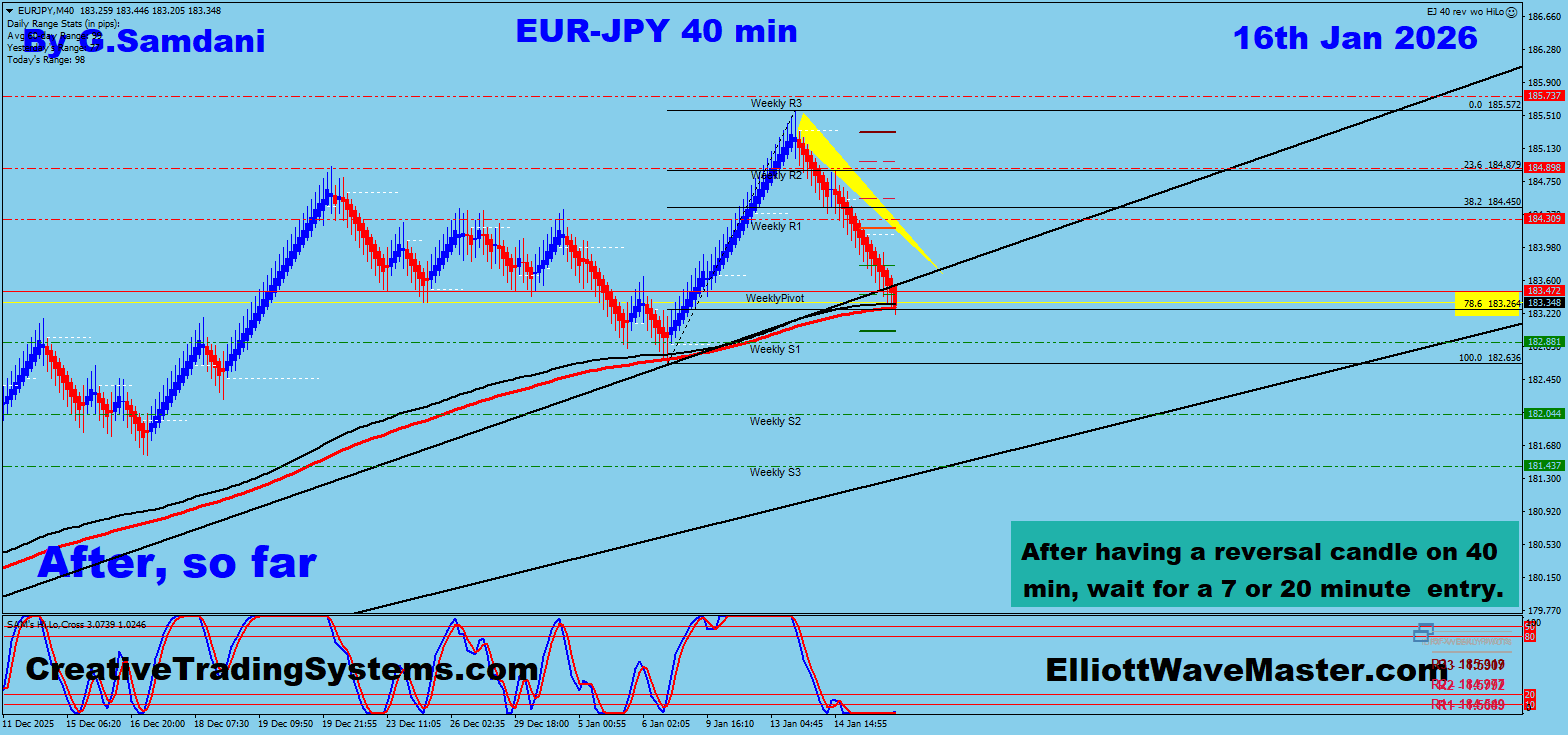
EUR-JPY. ” After ” 01-16-26.
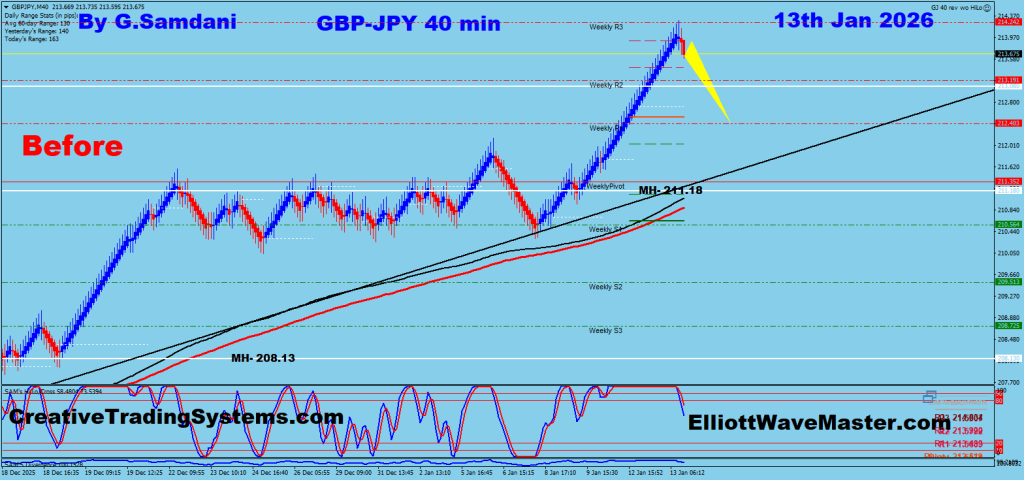
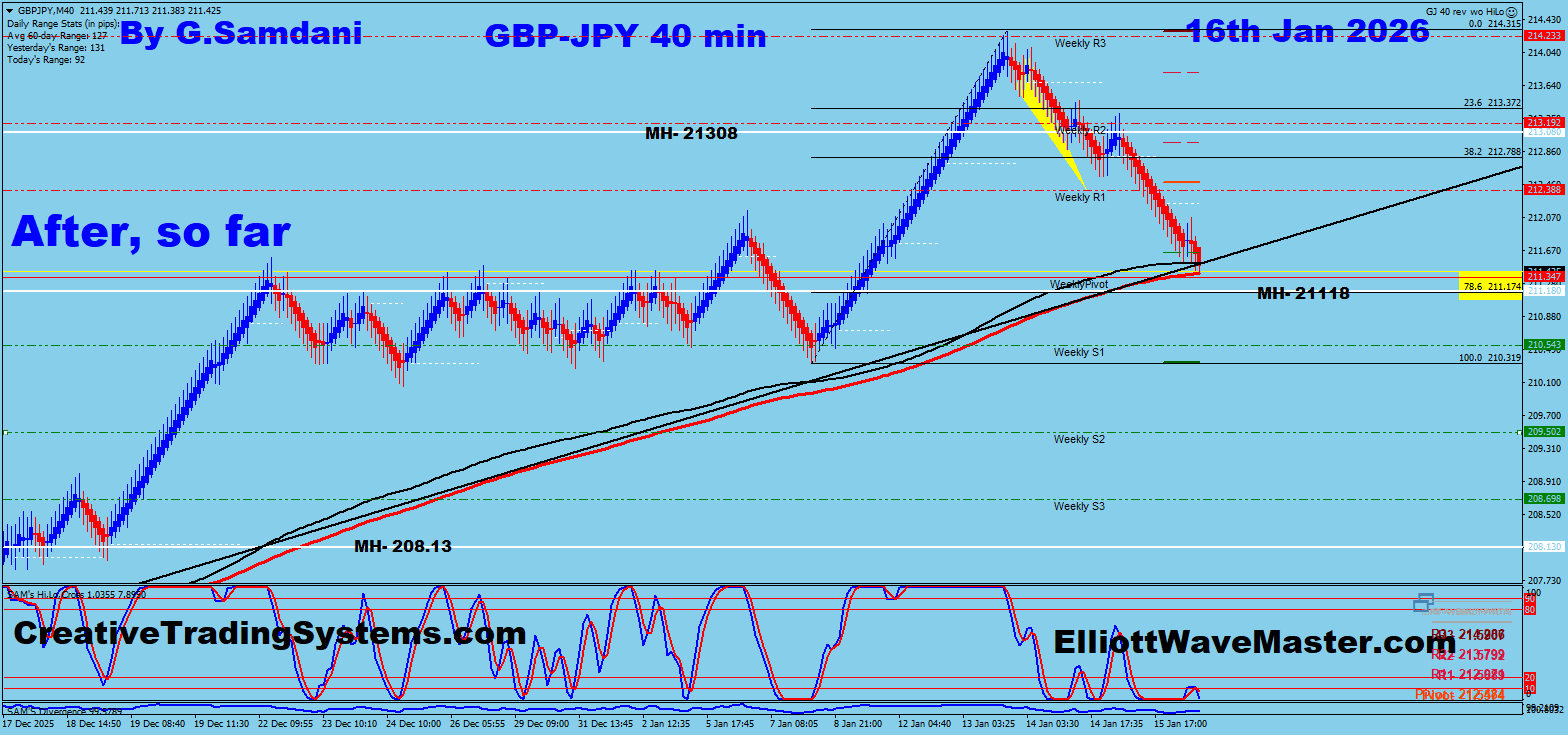
GBP-JPY ” Before “. 01-13-26.
GBP-JPY. ” After ” 01-16-26.
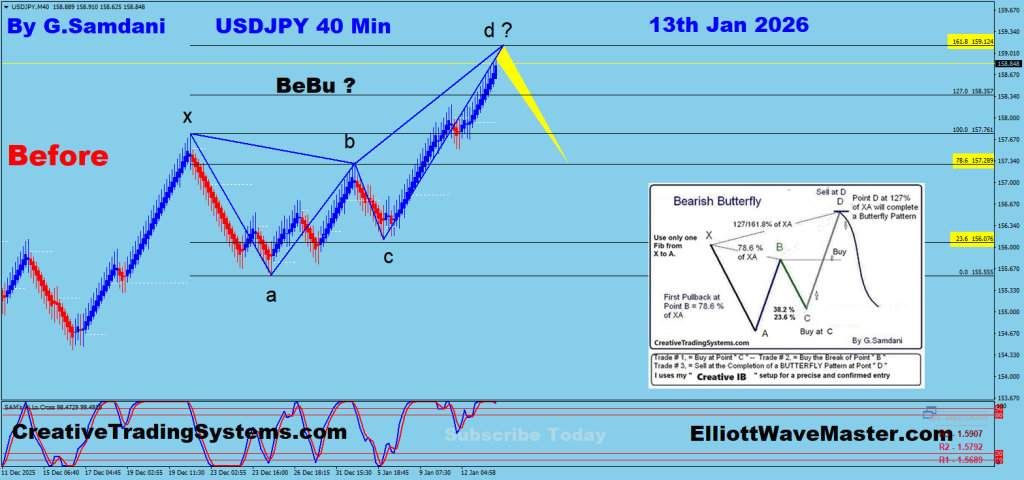
USD-JPY ” Before “. 01-13-26.
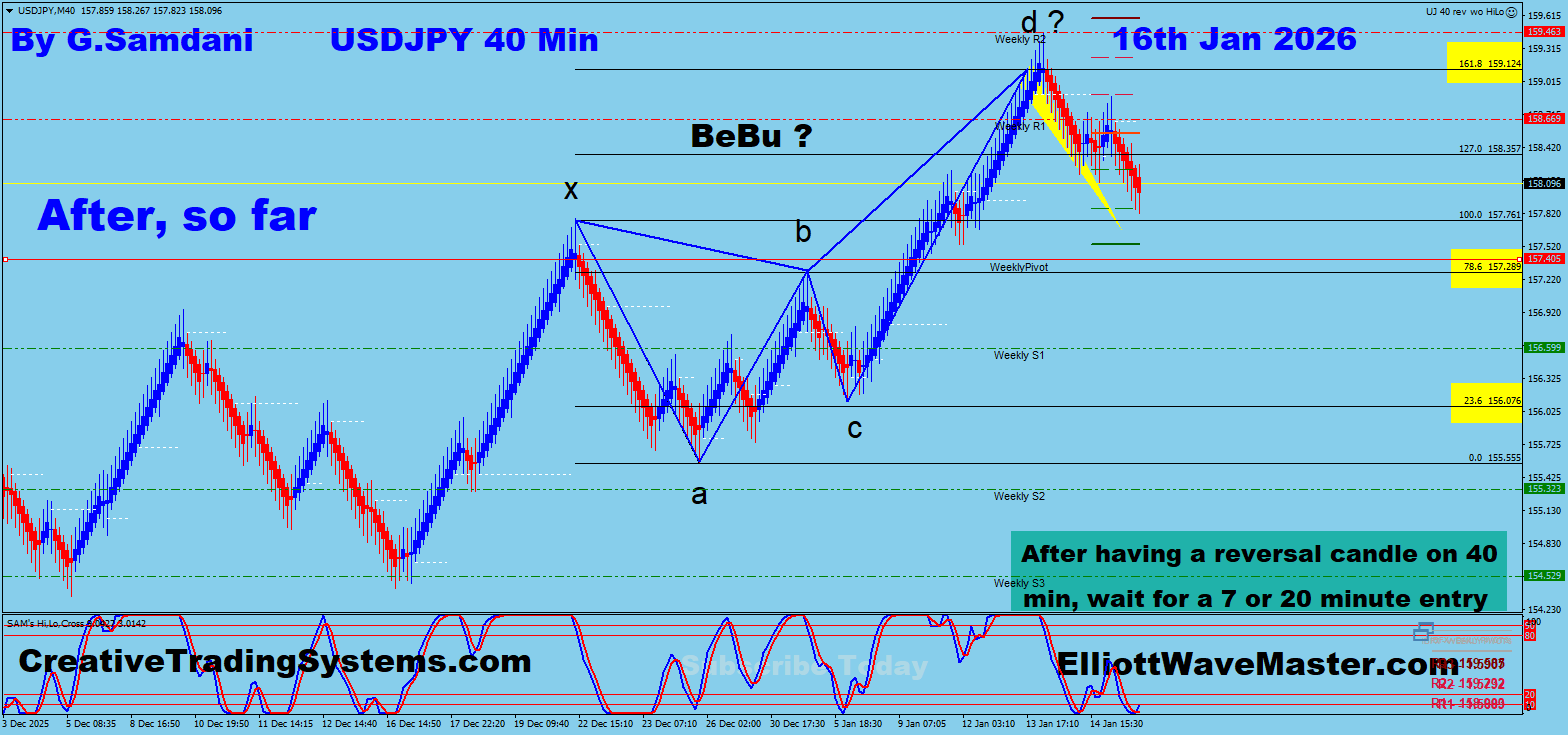
USD-JPY. ” After ” 01-16-26.
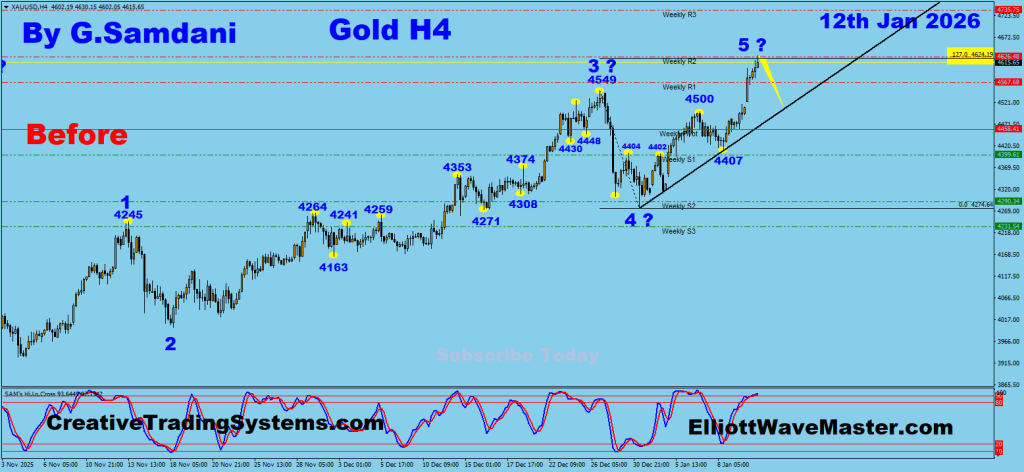
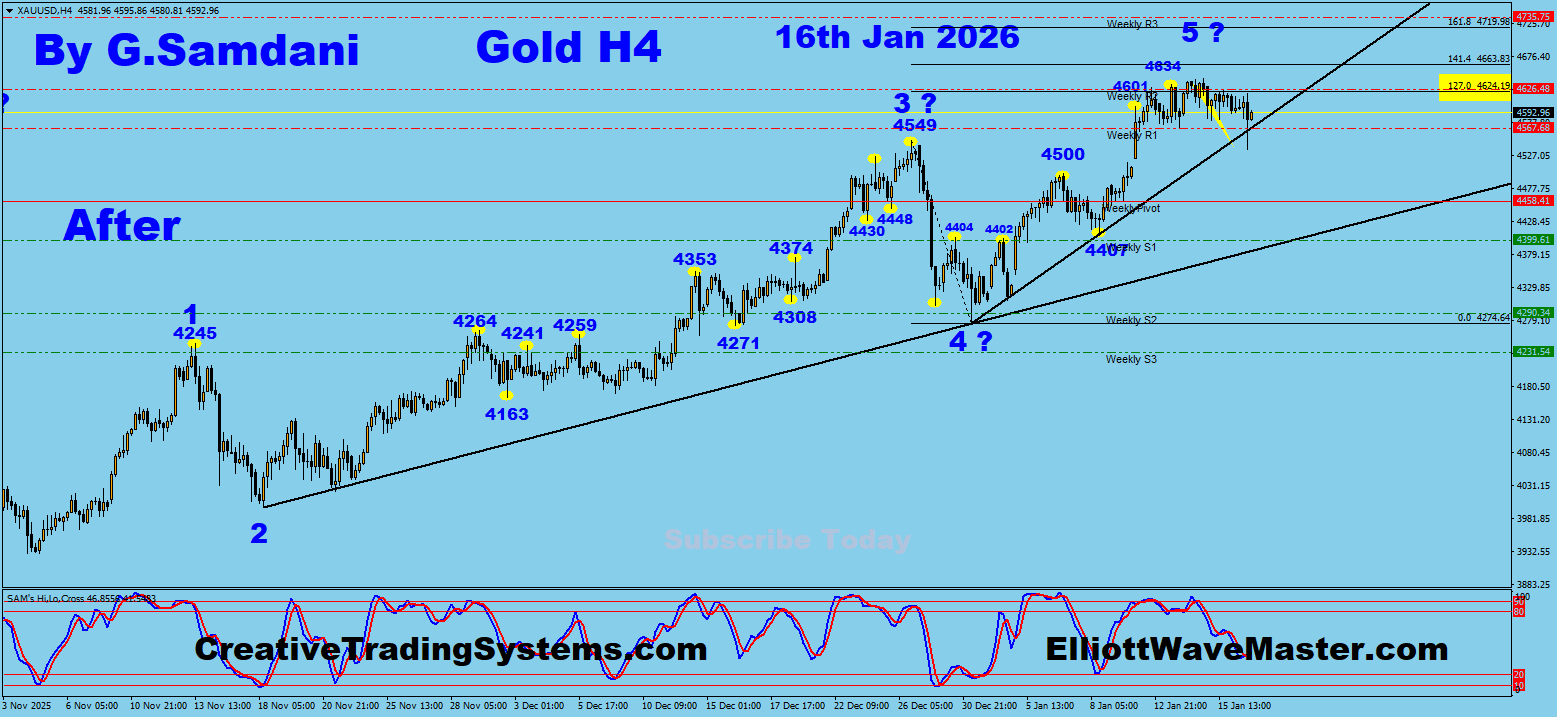
GOLD. ” Before “. 01-12-26.
GOLD. ” After ” 01-16-26
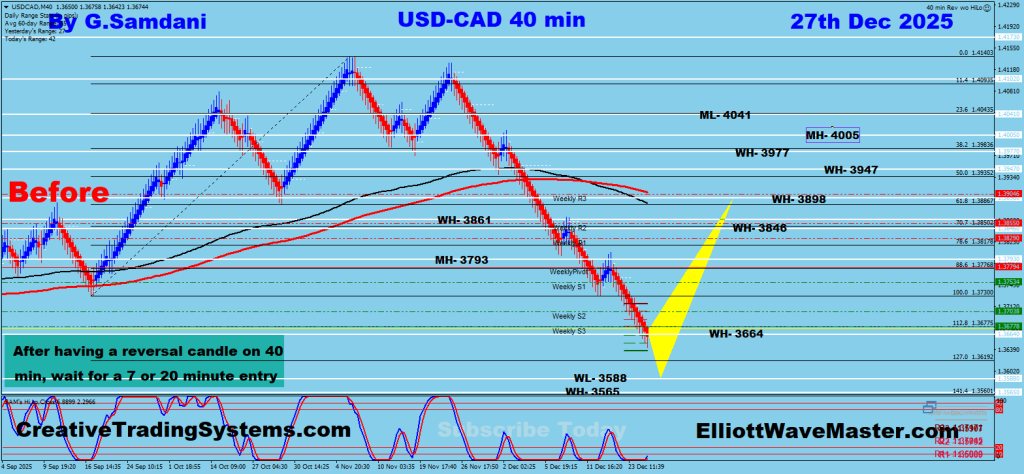
USD-CAD. ” Before “. 12-27-25.
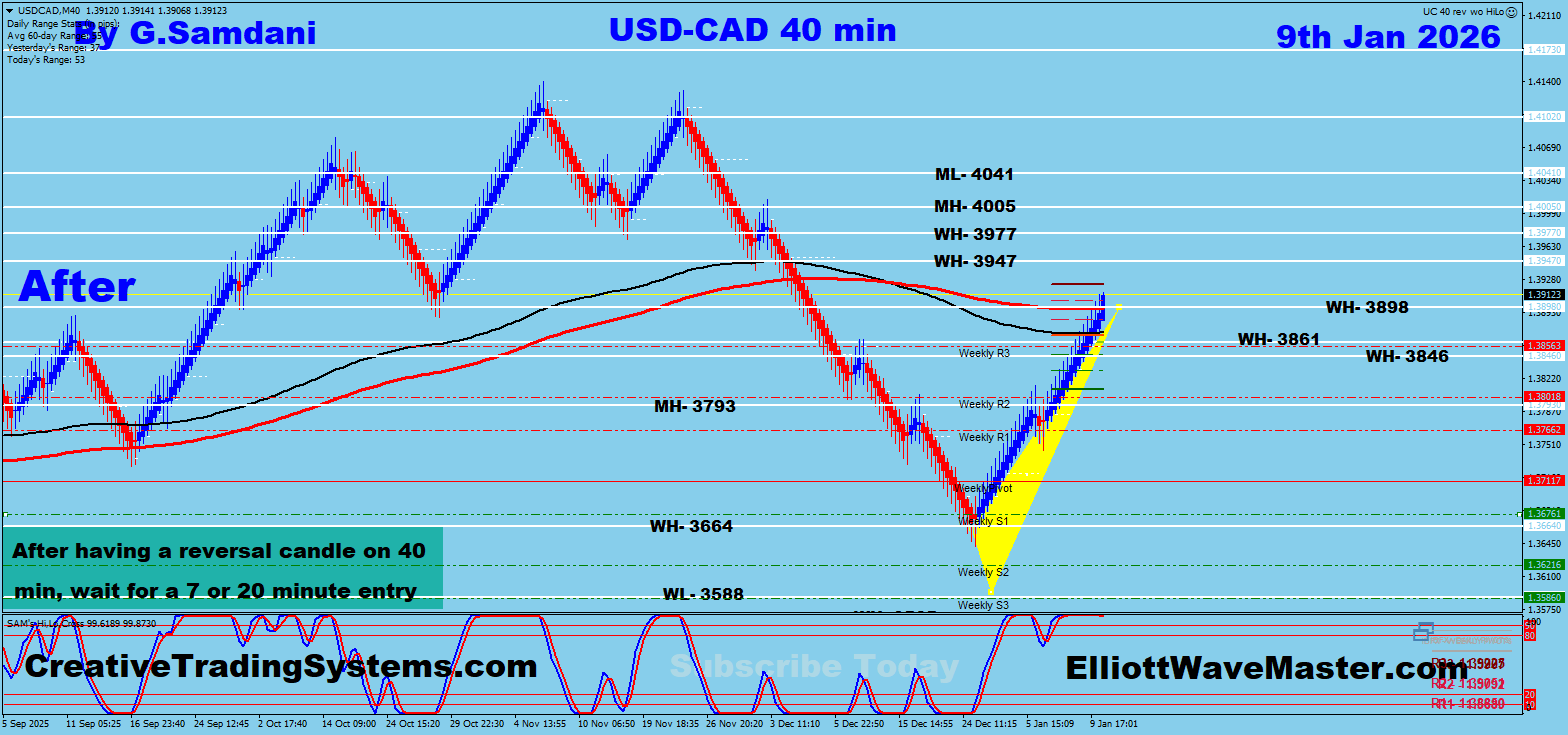
USD-CAD. ” After ” 01-09-26.
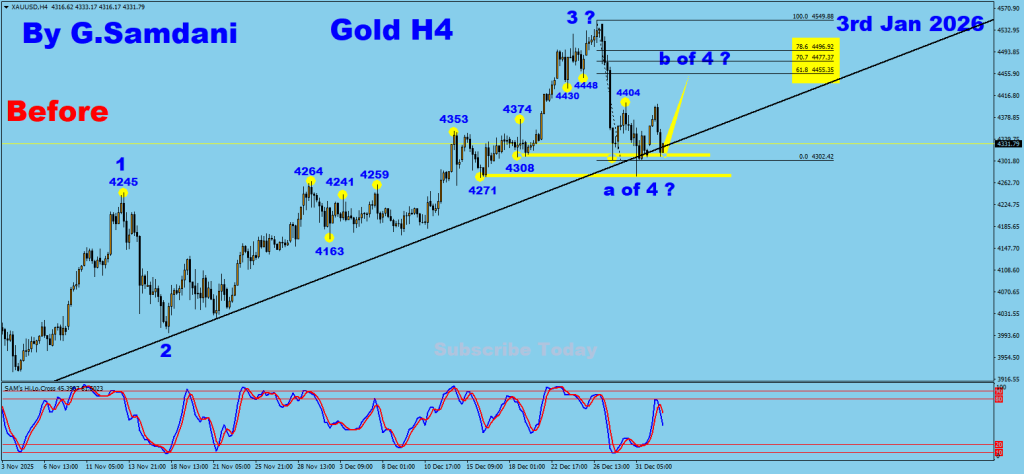
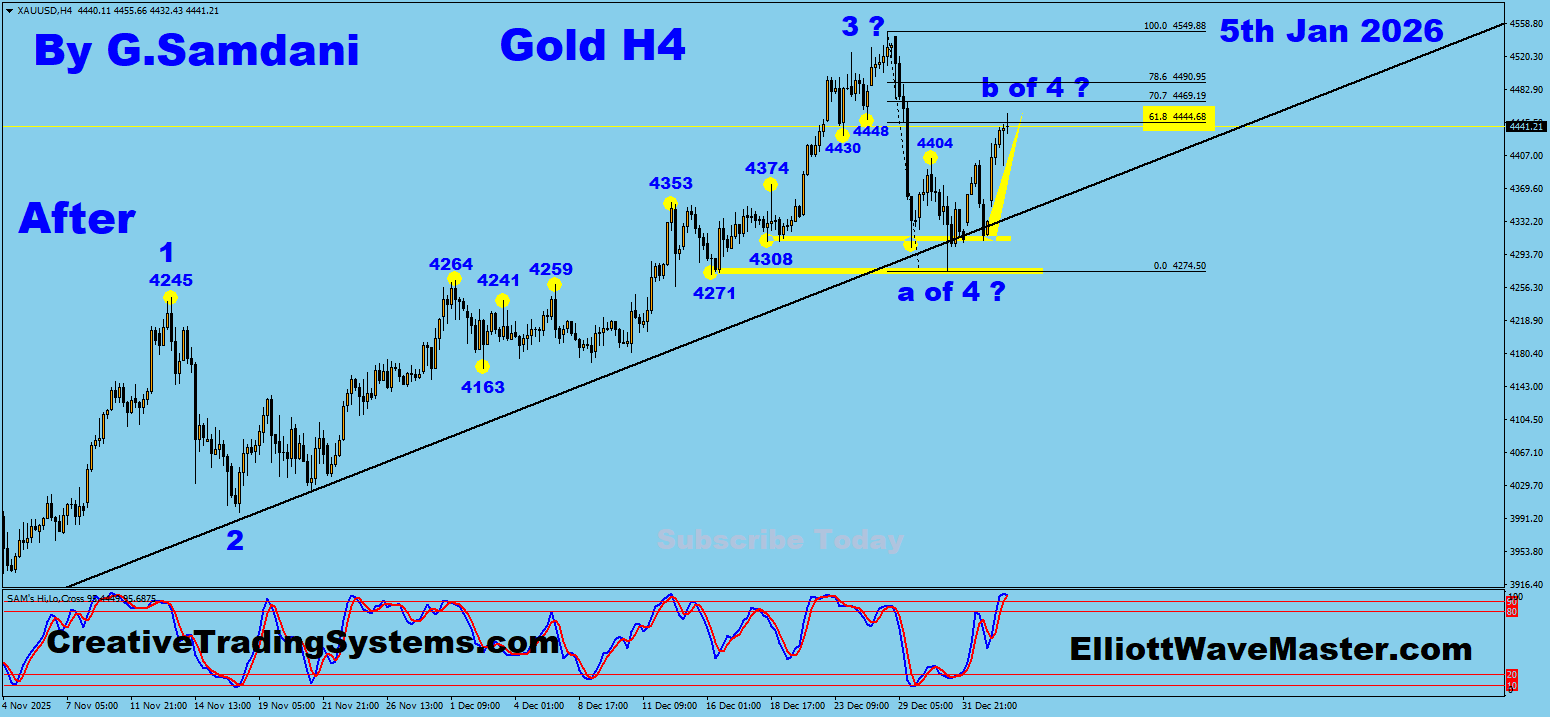
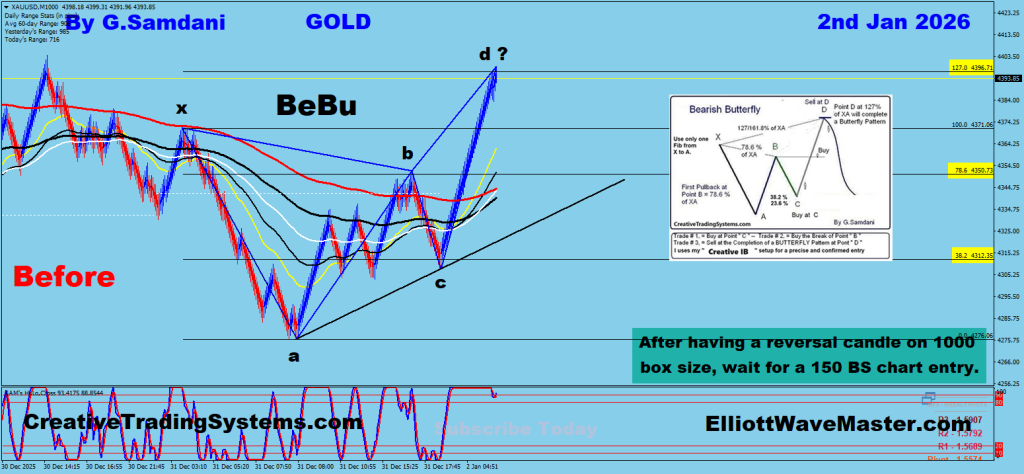
GOLD. ” Before “. 01-03-26.
GOLD. ” After ” 01-05-26.
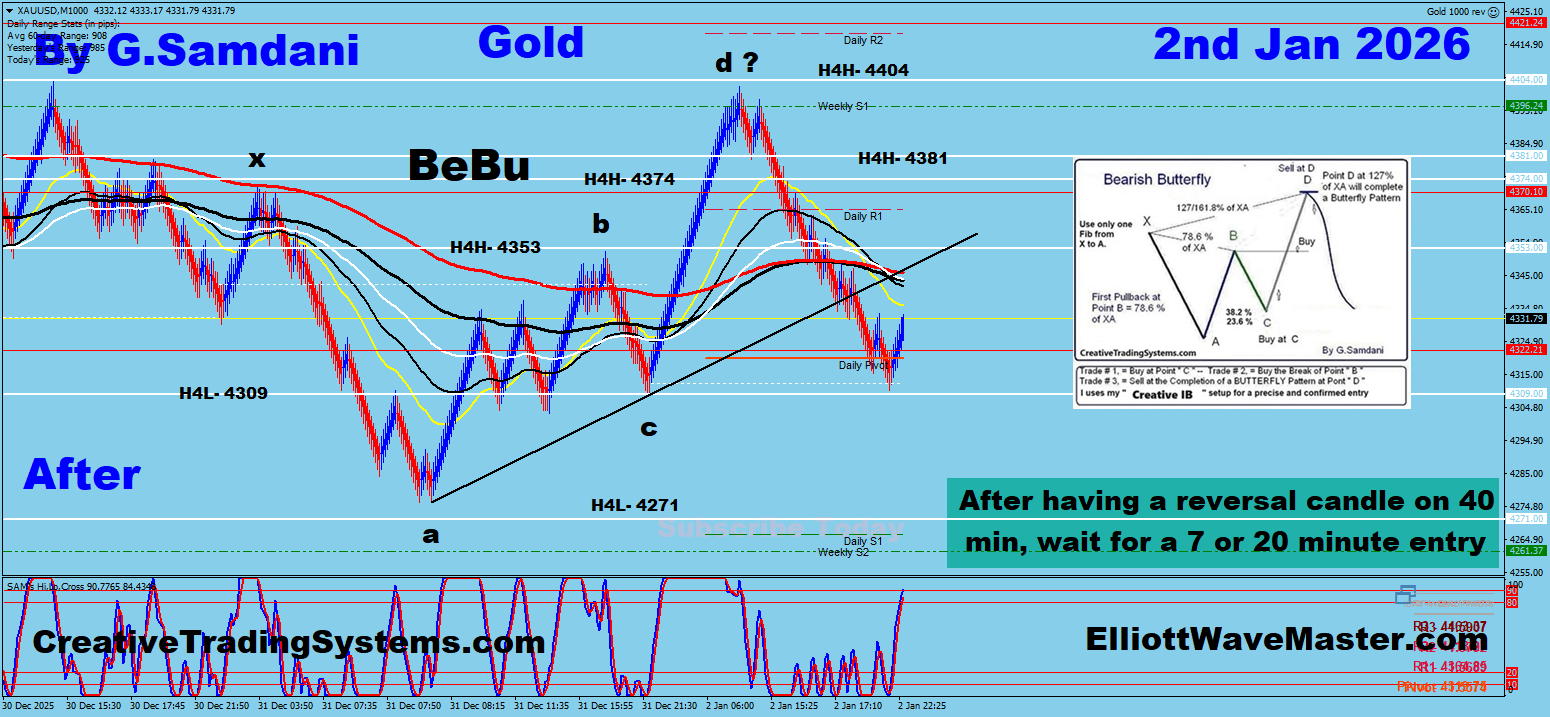
GOLD. ” Before “. 01-02-26.
GOLD. ” After ” 01-02-26.