Watch the video to see how this system works and the kind of trades it produces. If it looks like something that could work for you, everything you need is in the menu above.
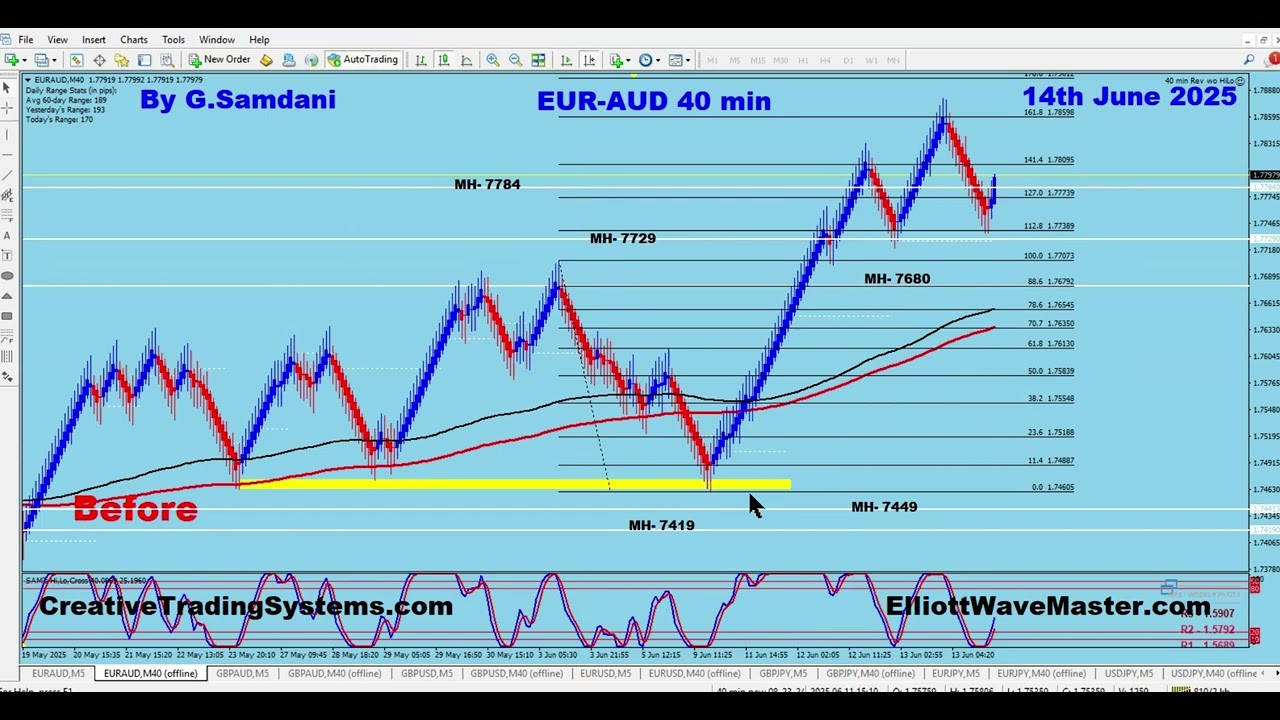
It's a trading system I've been using and refining since 2012. It's built around Renko candles — a different way of reading the market that cuts out a lot of the noise you get on normal charts. I use it alongside Elliott Wave analysis and Fibonacci levels to find trade setups. It works across Forex, Gold, Oil, Indices, and Crypto. The trade on the right is an example of what it produces.
Renko charts strip time out of the equation and plot only price movement — which is exactly why the Creative Renko System is built around them instead of standard candlesticks.
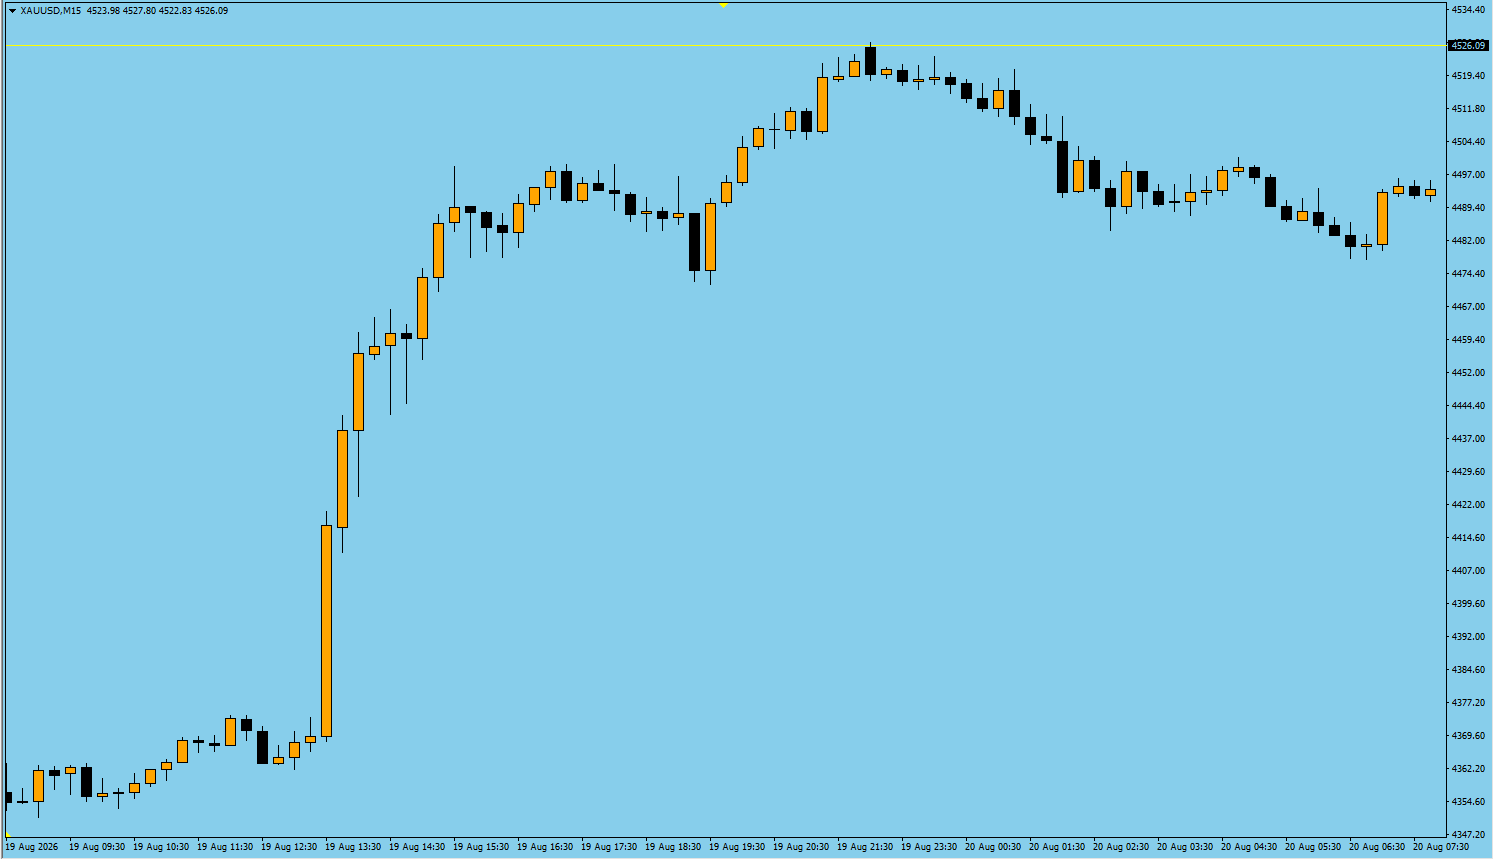
Same move, standard time-based candles — the small pullbacks inside the trend are much harder to spot.
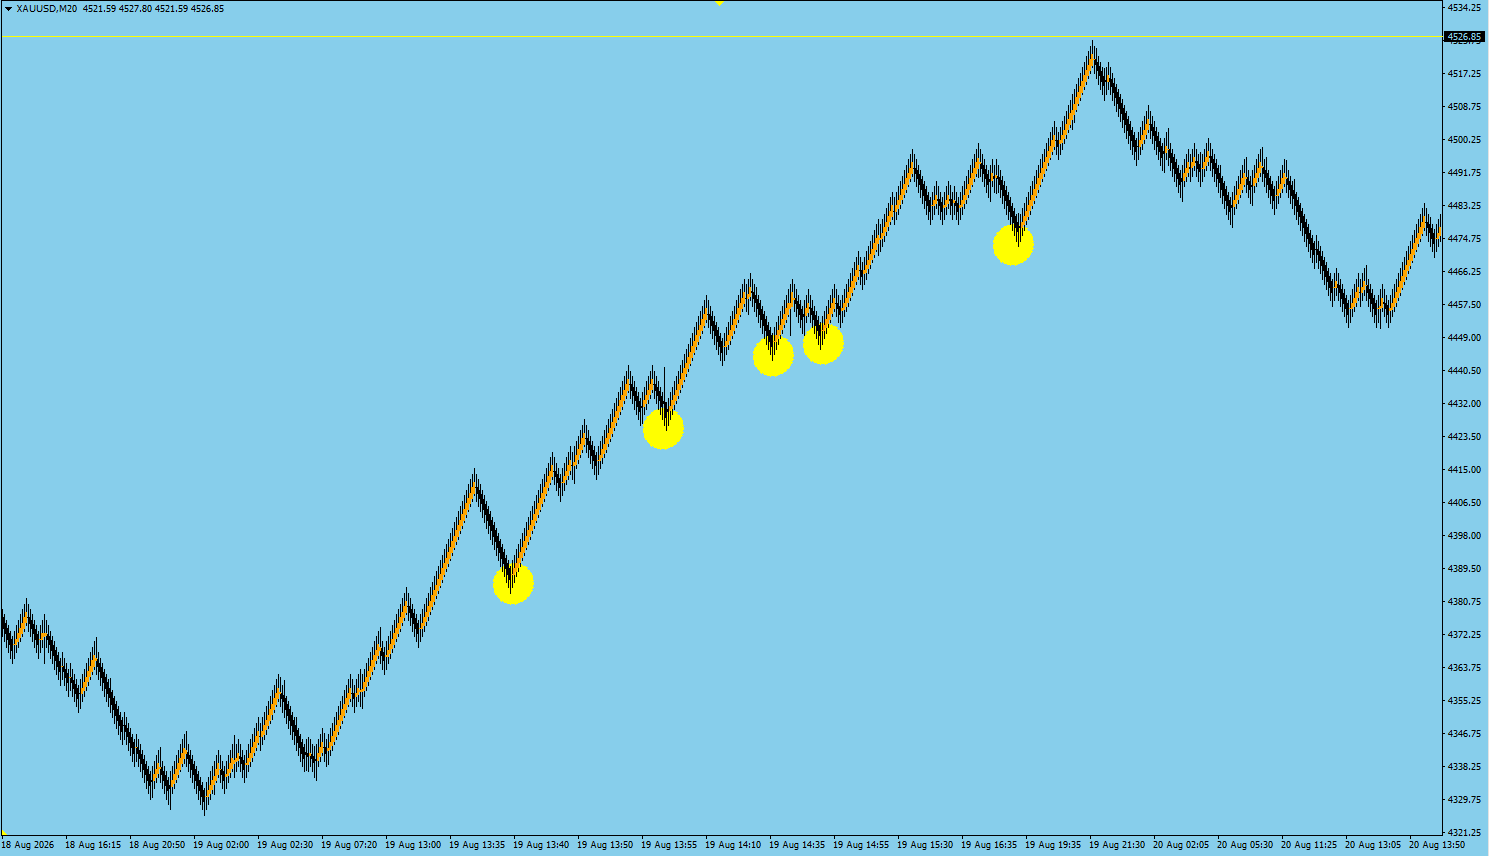
The circled retracements are exactly the same price action — but on Renko, each pullback is obvious. On the candlestick chart above, those same retracements barely show up at all.
A standard candlestick chart prints a new candle every minute, hour, or day — whether or not anything actually happened. A Renko chart ignores time completely and only prints a new "brick" once price moves a fixed number of pips, called the box size. No movement, no new brick — no matter how much time passes.
That single difference is why Renko is better for reading price action cleanly. Small back-and-forth chop that clutters a normal chart simply doesn't show up, so retracements, turning points, and trend structure become far easier to see — as shown in the charts above, where the same exact price move looks noisy and unclear on candlesticks but shows every retracement clearly on Renko. That clarity is exactly why the Creative Renko System is built around Renko charts instead of standard candlesticks.
A structured, multi-timeframe approach that combines classical technical analysis with an automated entry tool — so you always know what to look for, exactly when to act, and how to manage the trade once you're in it.
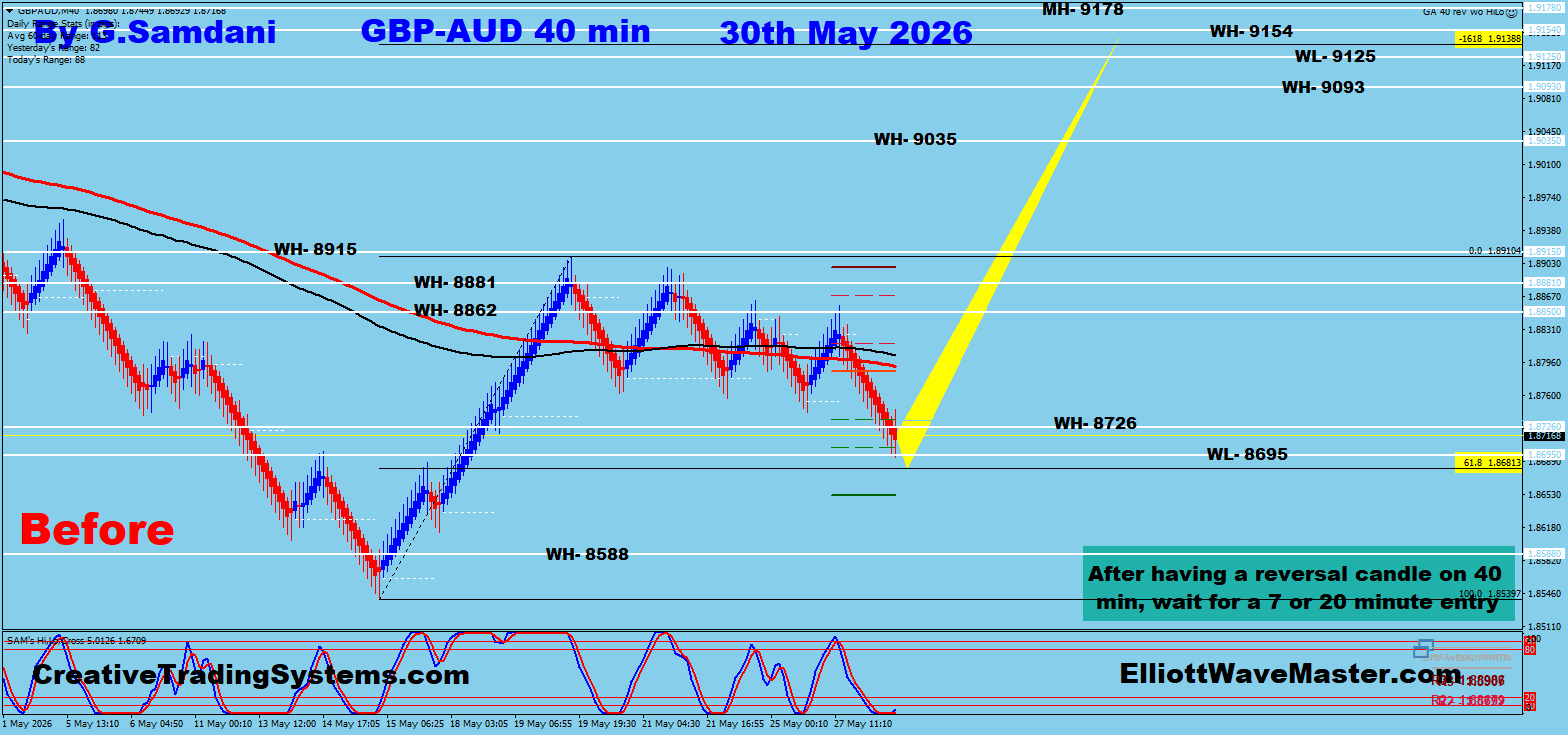
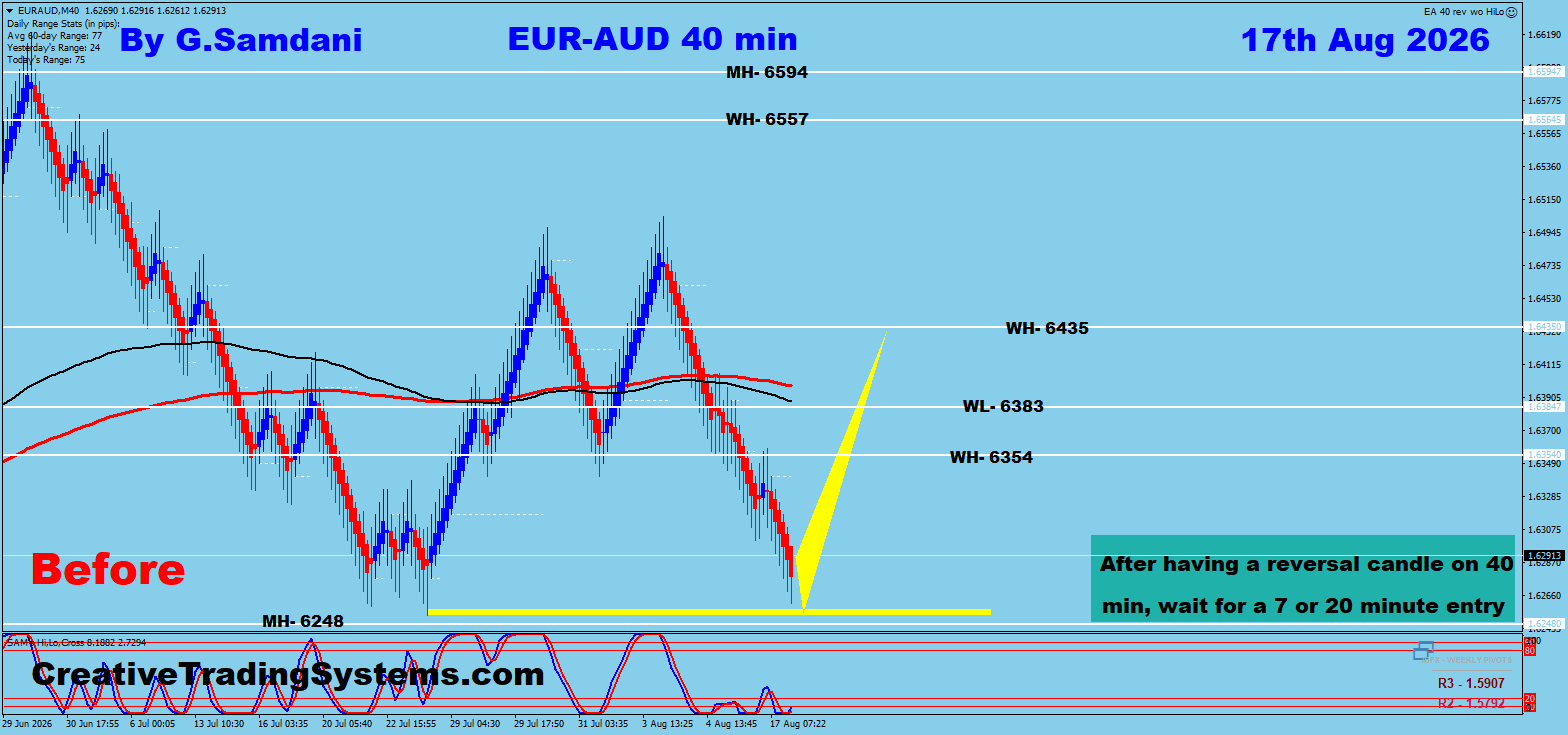
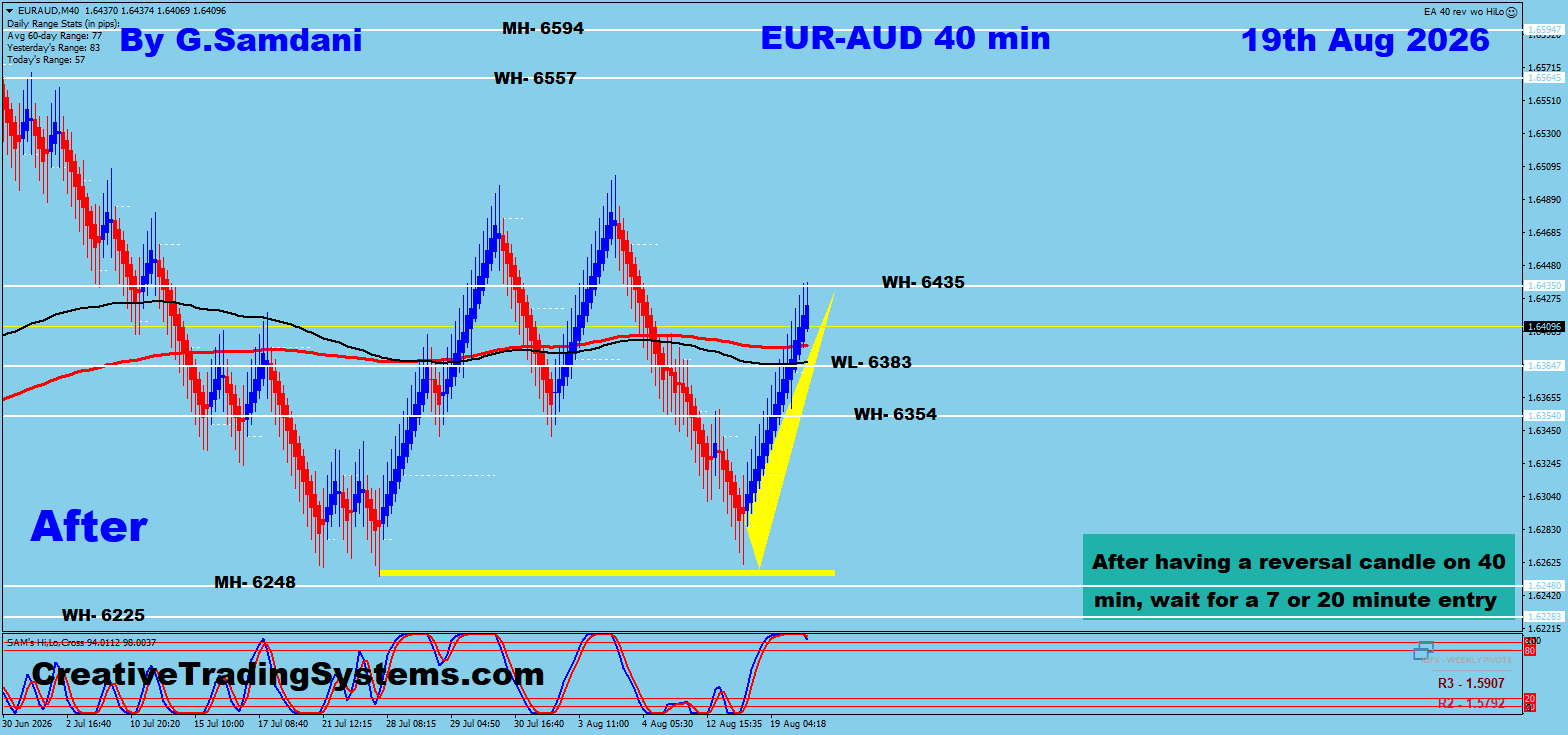
The 40 minute is your bigger timeframe — this is where all the analysis happens. Use Elliott Waves, Harmonic Patterns, Fibonacci extension and retracement levels, and key Support & Resistance zones to identify the direction and pinpoint where price is likely to stop and reverse.
Once you spot that reversal candle forming at one of those key zones, you're ready to move to the entry charts.
I post this exact 40 min analysis in the private Telegram channel as I mark it up — so you can follow along with the turning points in real time, not just the finished trade.
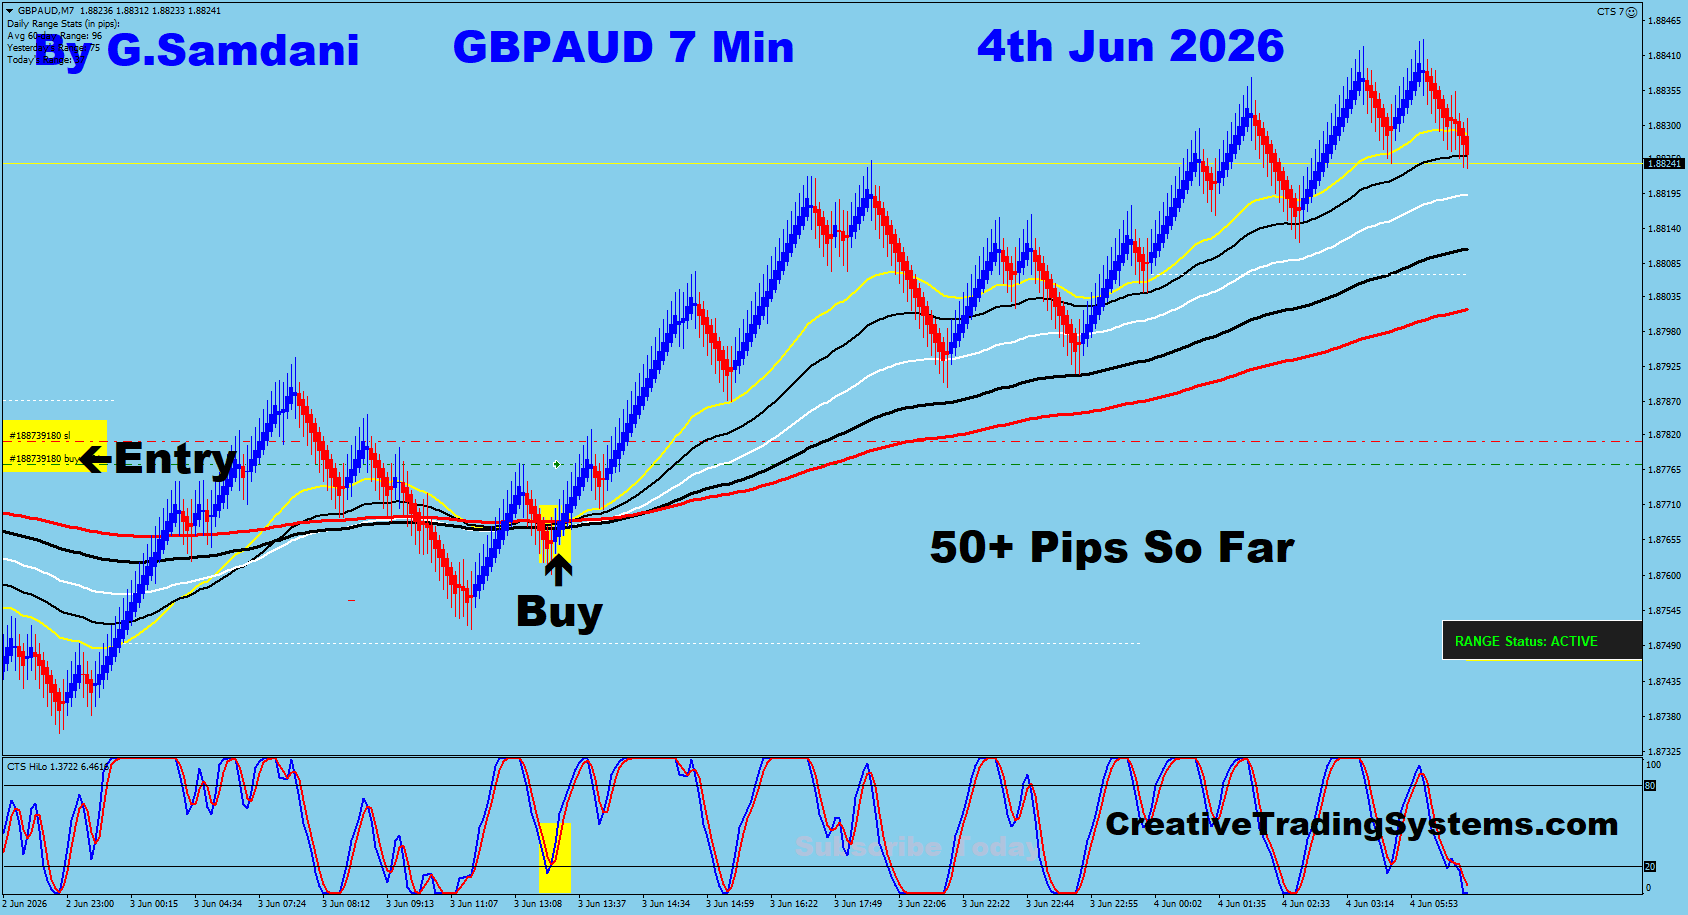
The moment a reversal candle confirms on the 40 min, switch straight to the 7 minute chart and attach the CTS-7 Expert Advisor. Set it to Long Only or Short Only depending on your direction.
No hesitation, no missed entries — the EA reacts in real time the instant conditions are met.
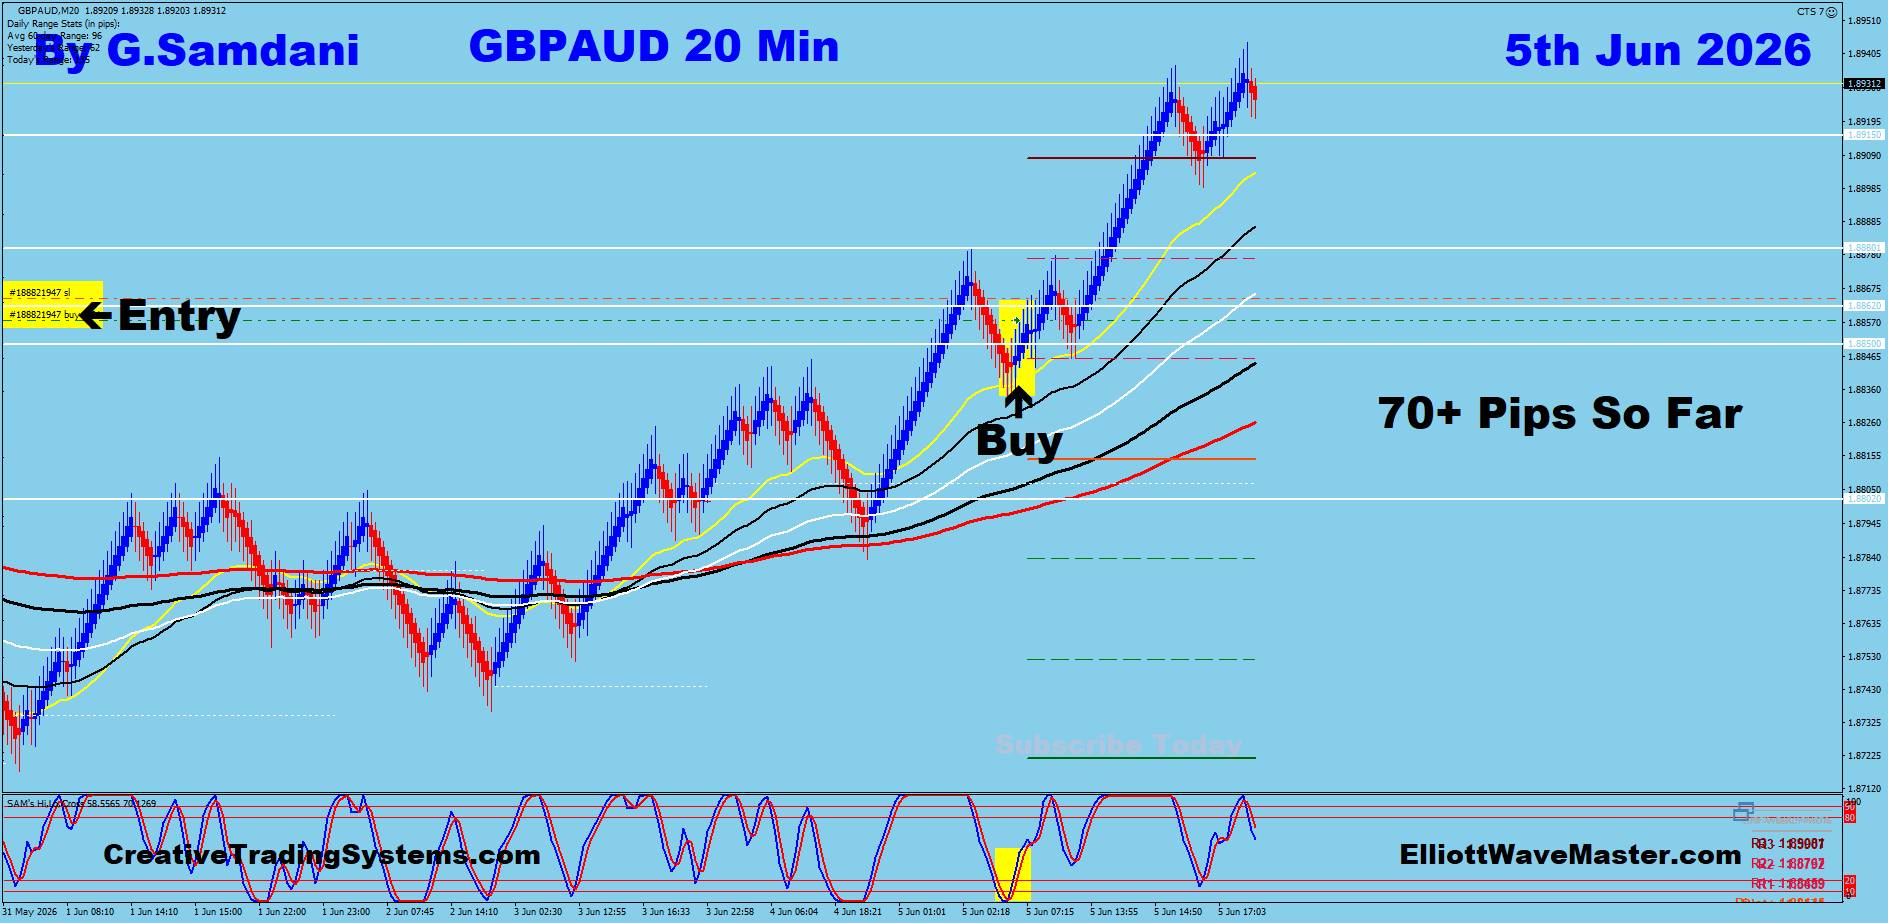
After the initial 40–50 pip move from the turn, the 20 minute chart will form its own fresh setup. This is your second entry — and it typically targets a much larger continuation move for those who want to stay in the trade longer.
The 20 min is still an entry chart, just like the 7 min — but it catches the extended leg of the move.
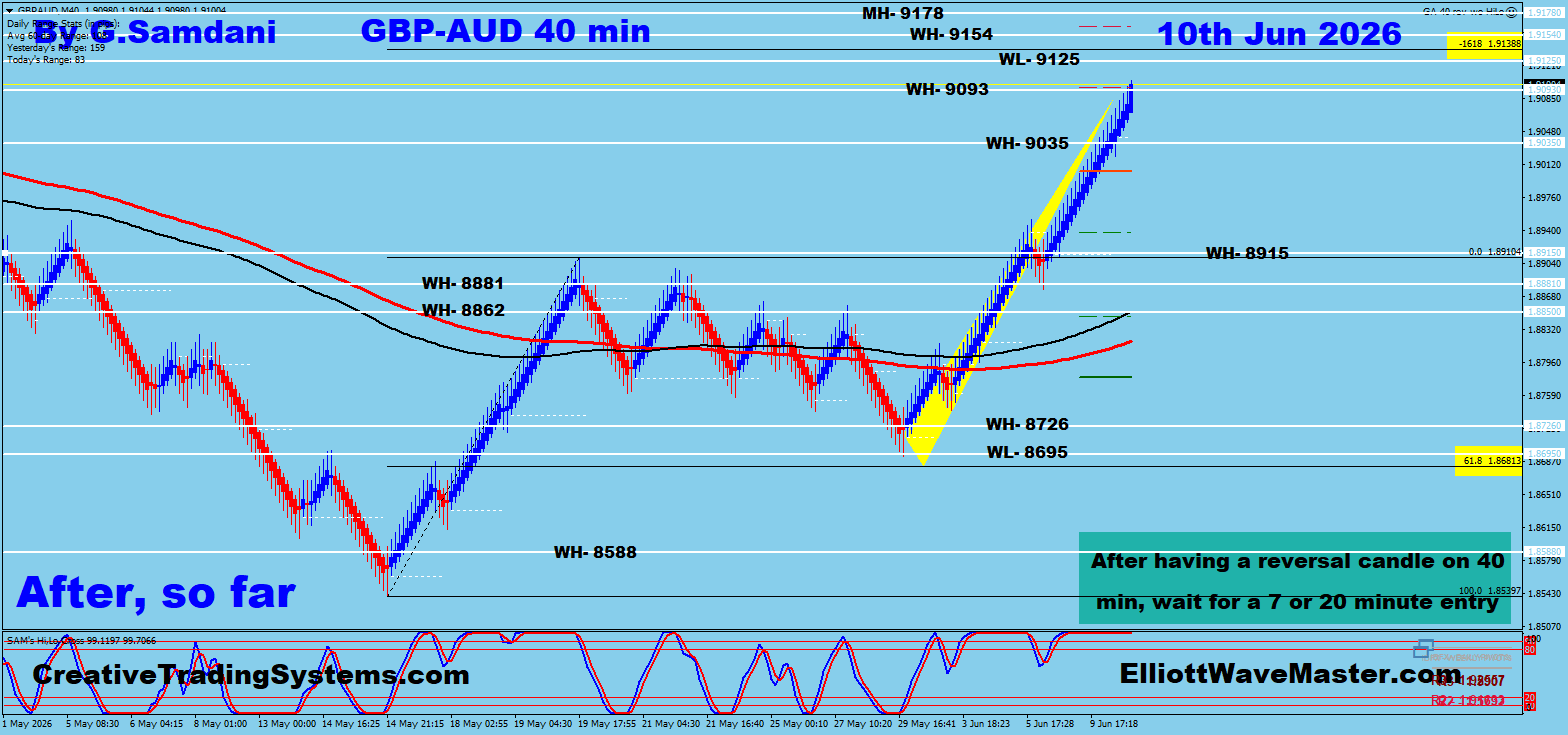
Once a trade is in profit, the EA can move the stop loss to breakeven and trail it as price continues in your favor — so a winning trade doesn't turn into a loser while you're away from the screen.
Once the move plays out, you zoom back out to the 40 minute chart and start the process again on the next turning point.
Welcome to my One On One Coaching. This course consists of 10 sessions, each 1 hour long. You will learn everything from basic technical analysis, like support & resistance, trendlines, Channels, and candlestick patterns, to advanced concepts like Elliott Waves, harmonic patterns, and most importantly, how to use Fibonacci tools like retracement, extension and expansion correctly to locate the precise turning points.