Chart Predictions
Most recent first
✅ Win
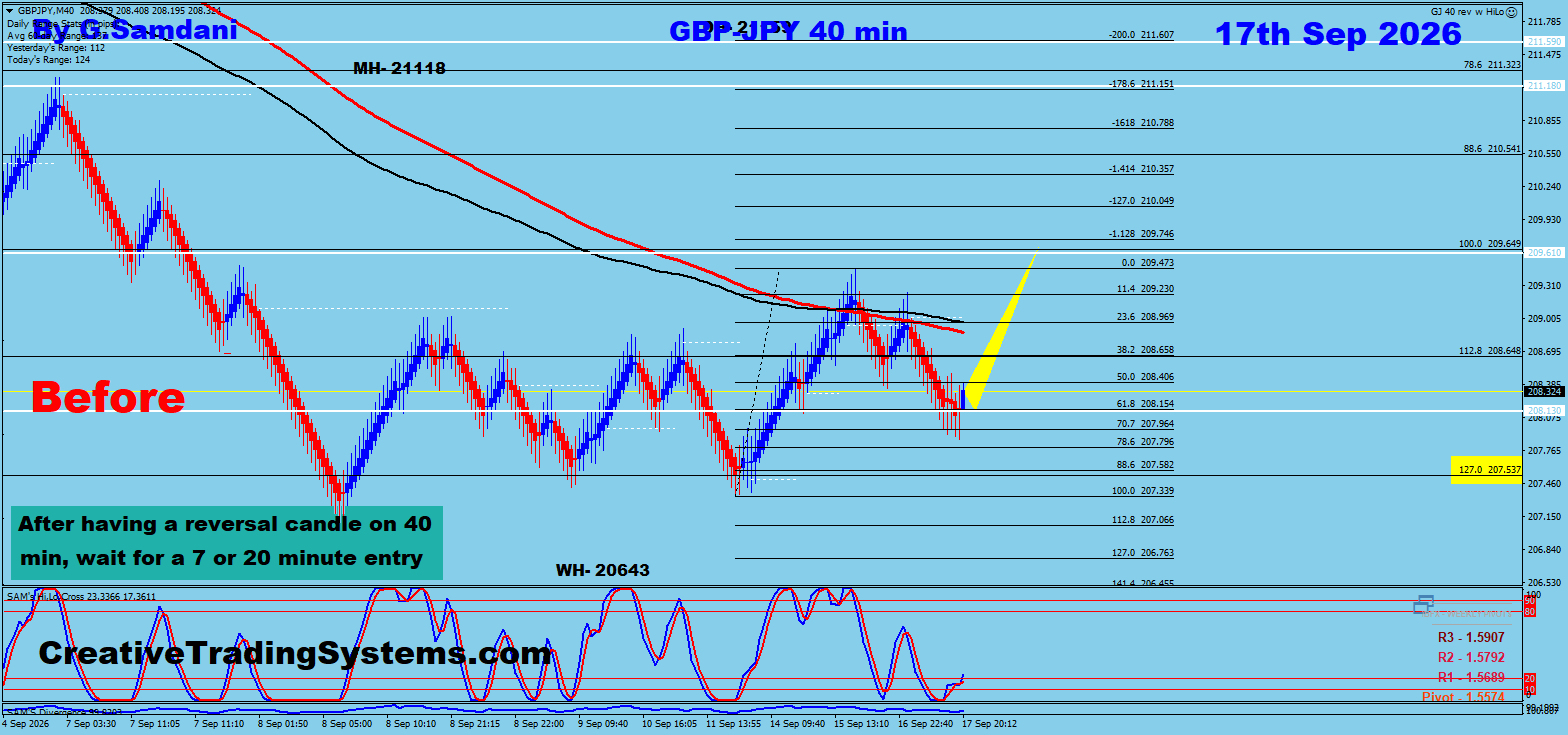
Before
September 17 — Marked-up analysis
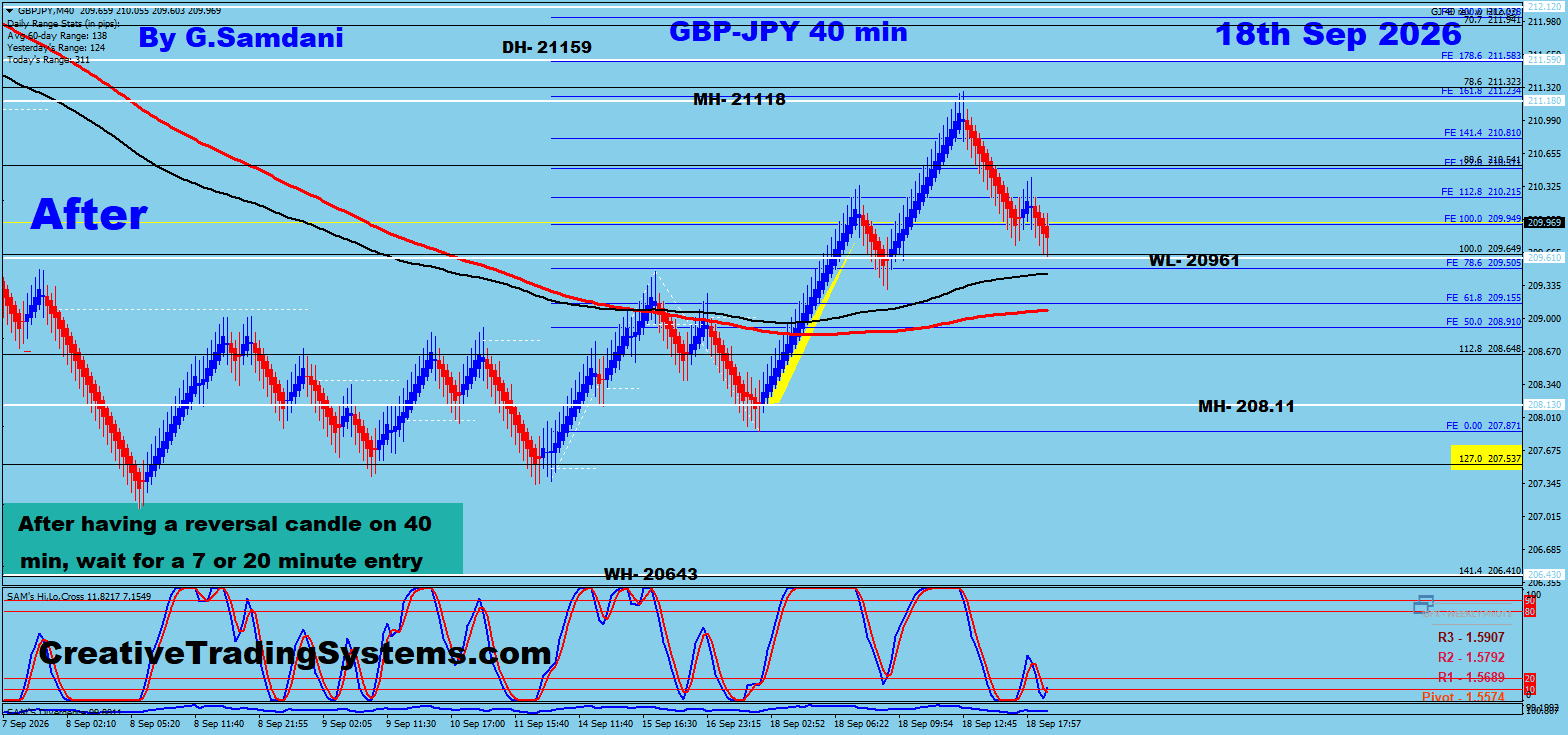
After
September 18 — Market outcome
✅ Win
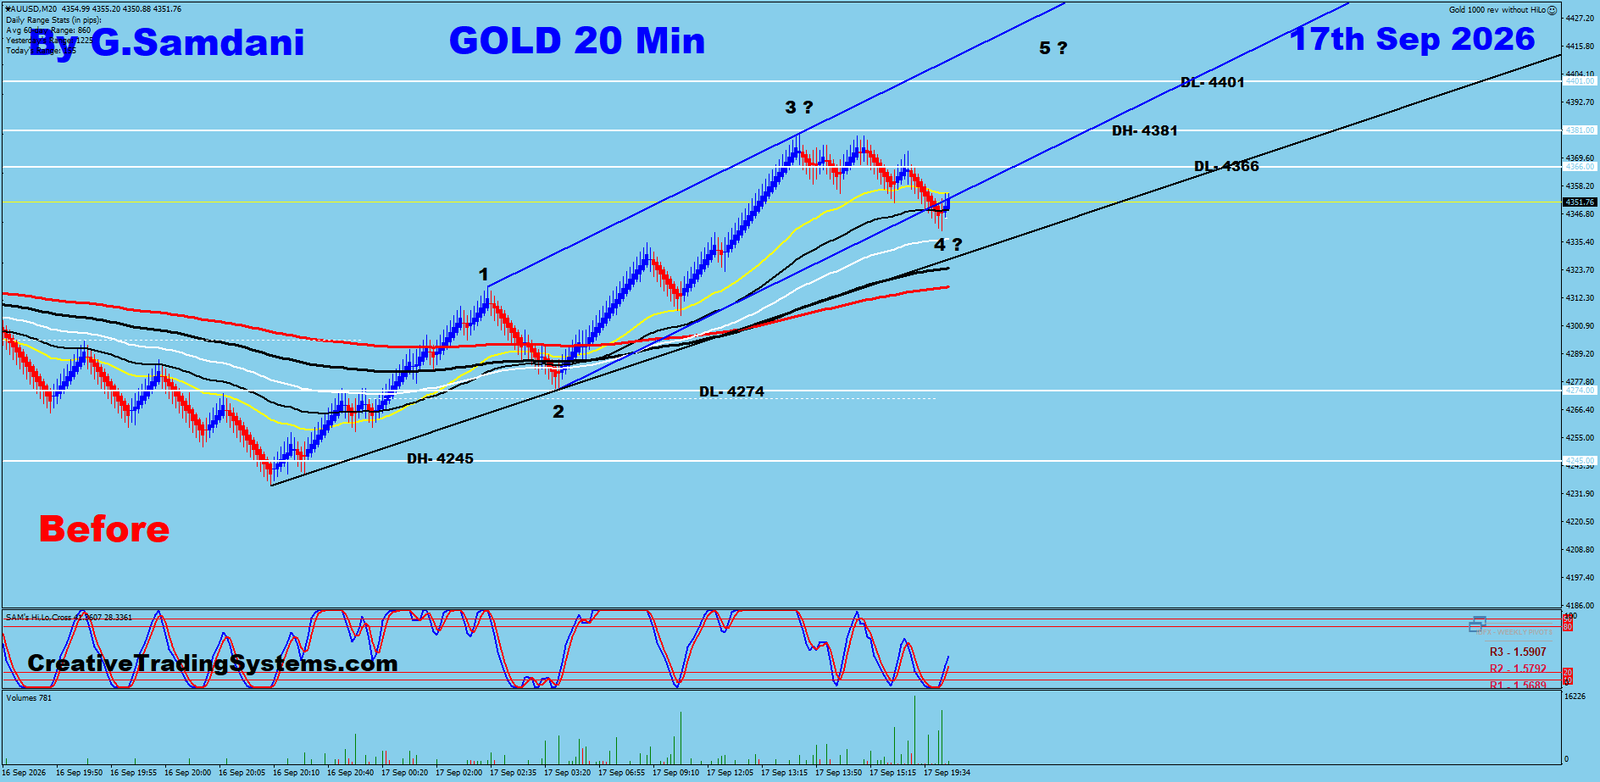
Before
September 17 — Marked-up analysis
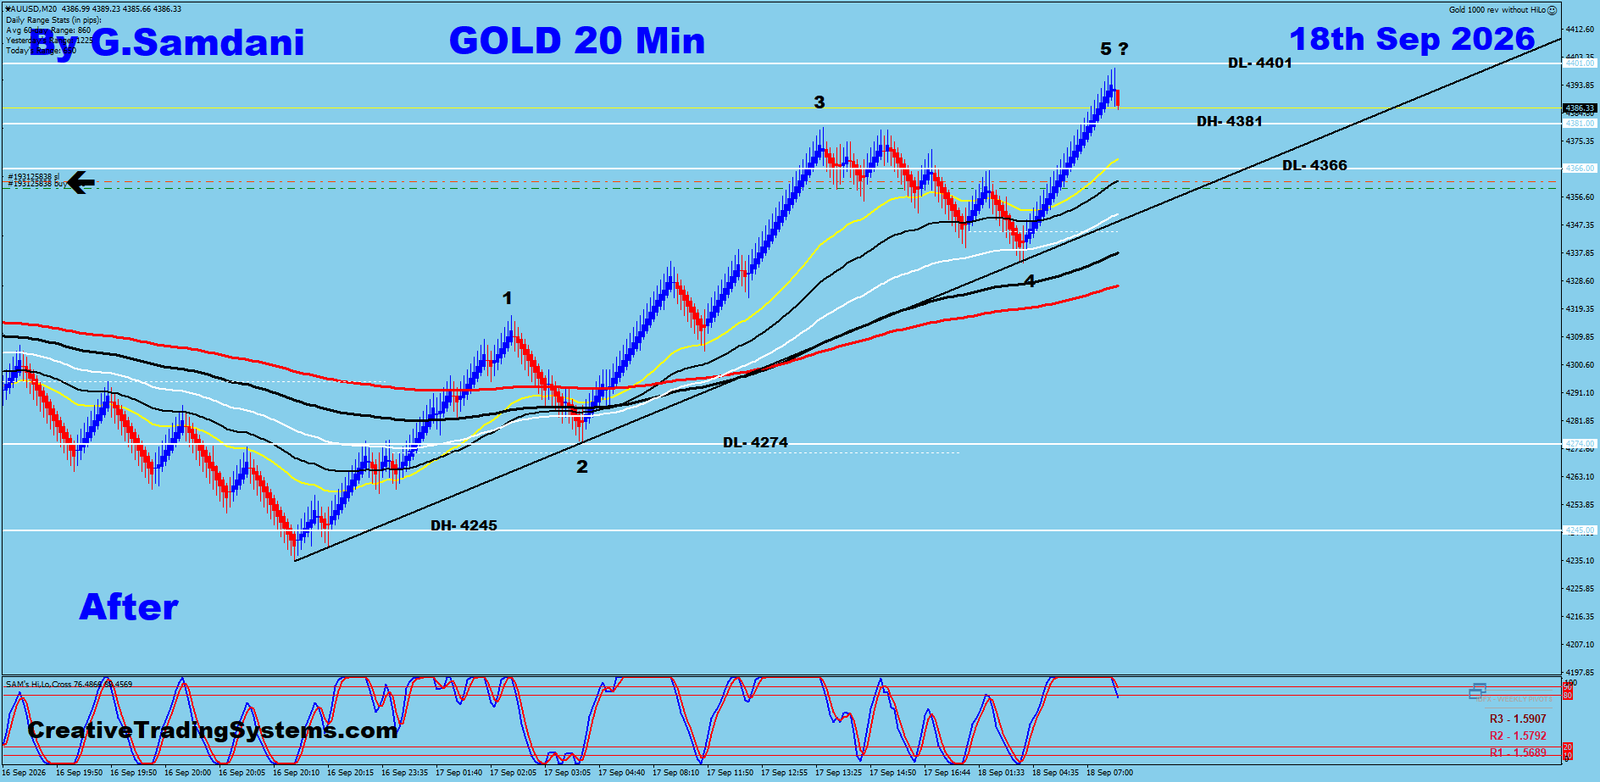
After
September 18 — Market outcome
✅ Win
Before
August 22 — Marked-up analysis
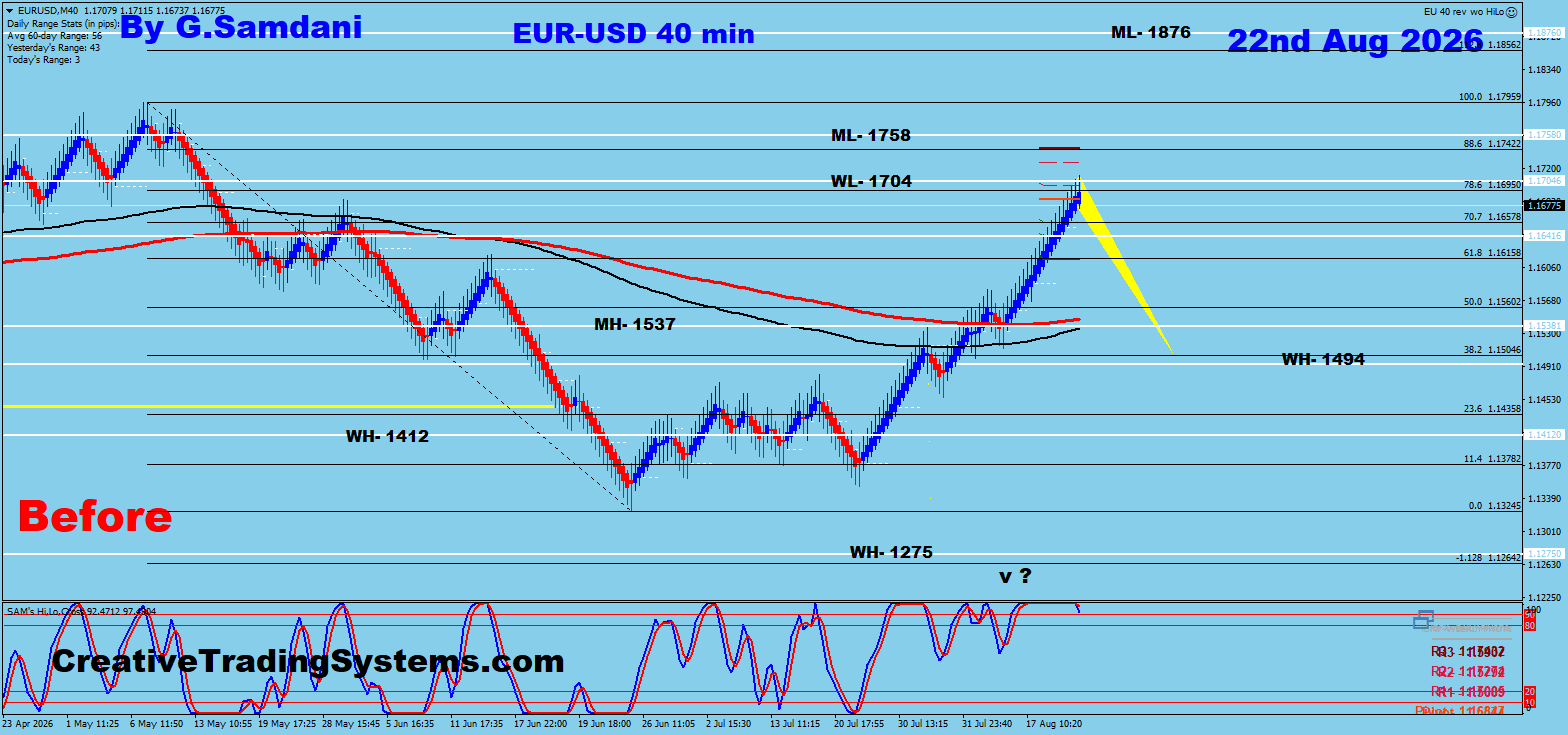
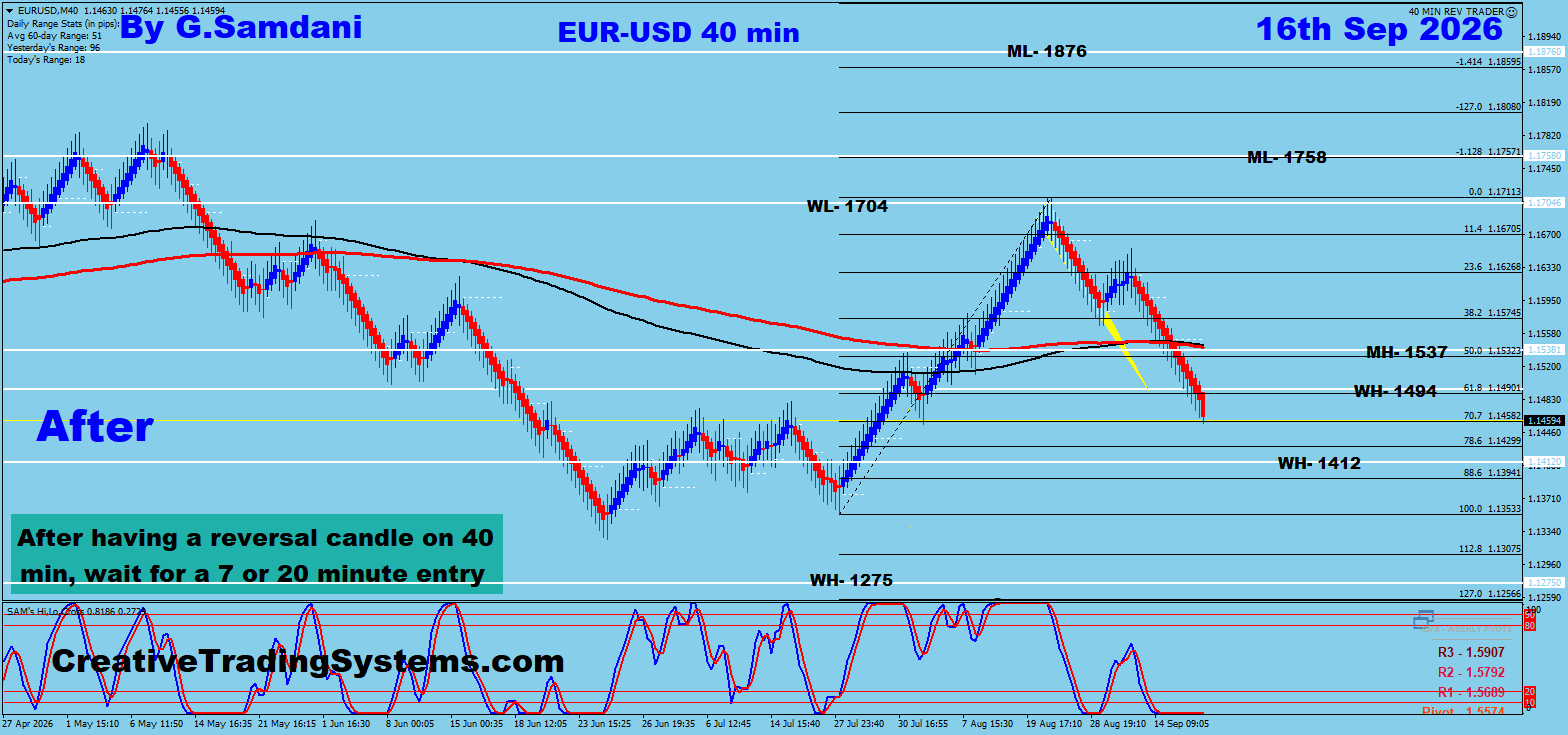
After
September 16 — Market outcome
✅ Win
Before
August 23 — Marked-up analysis
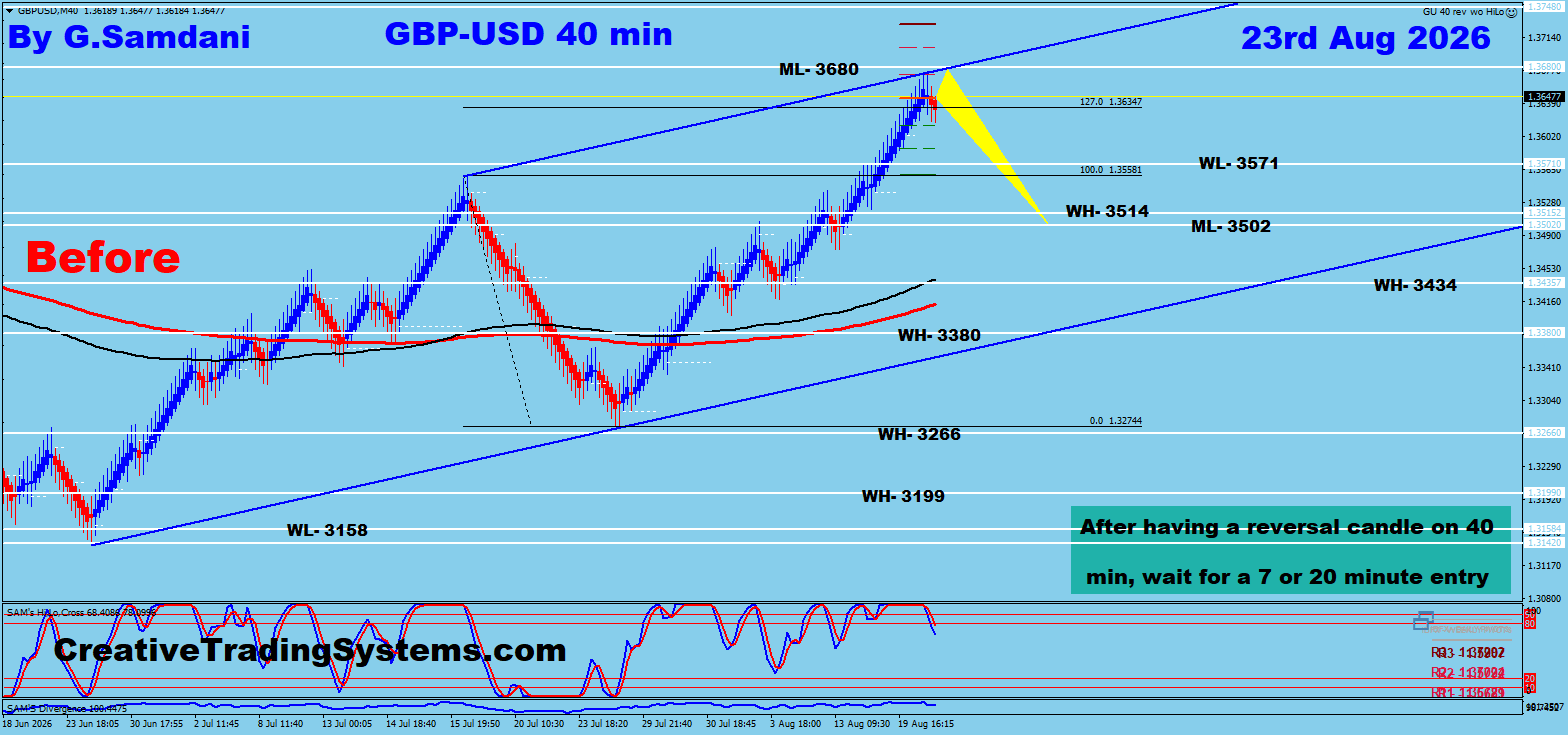
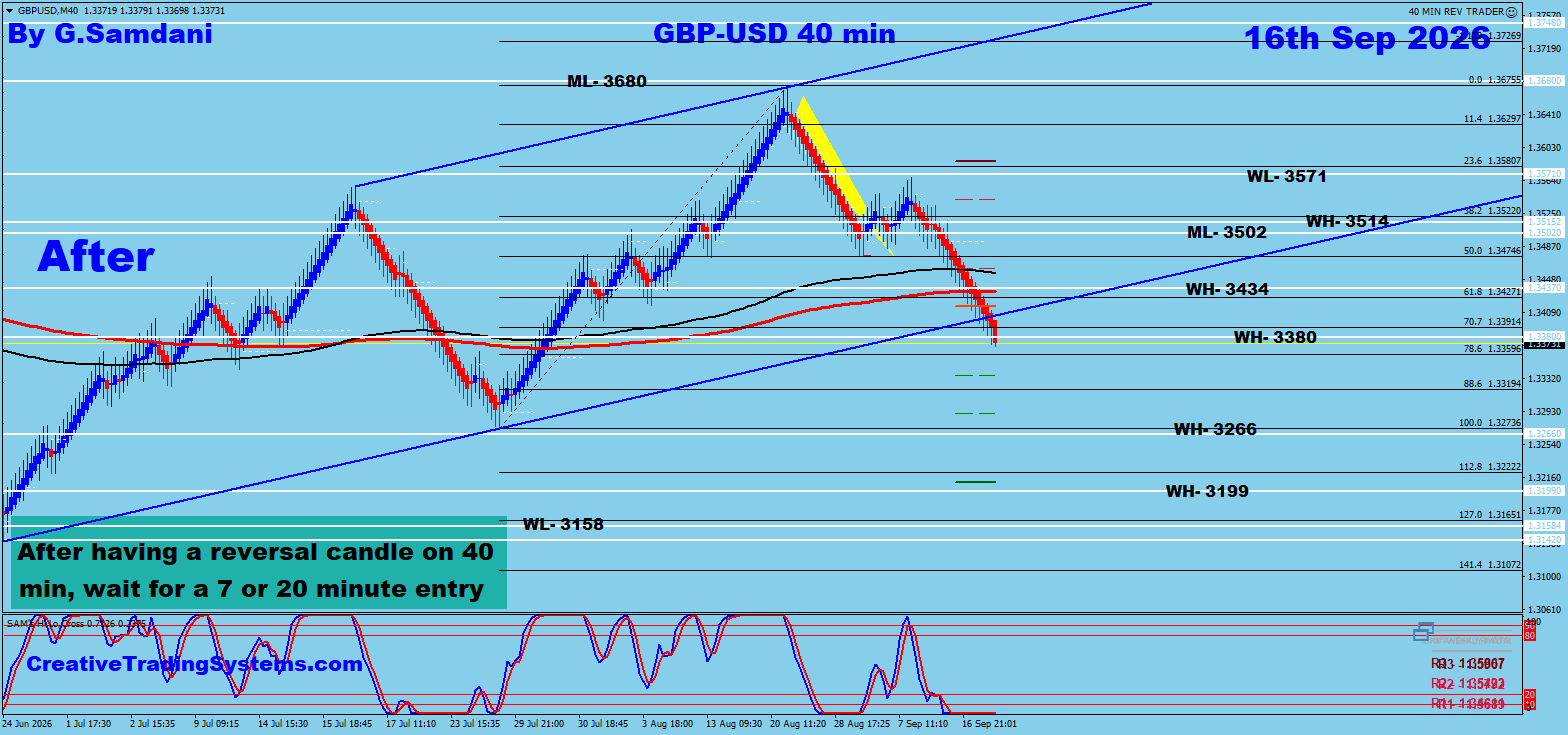
After
September 16 — Market outcome
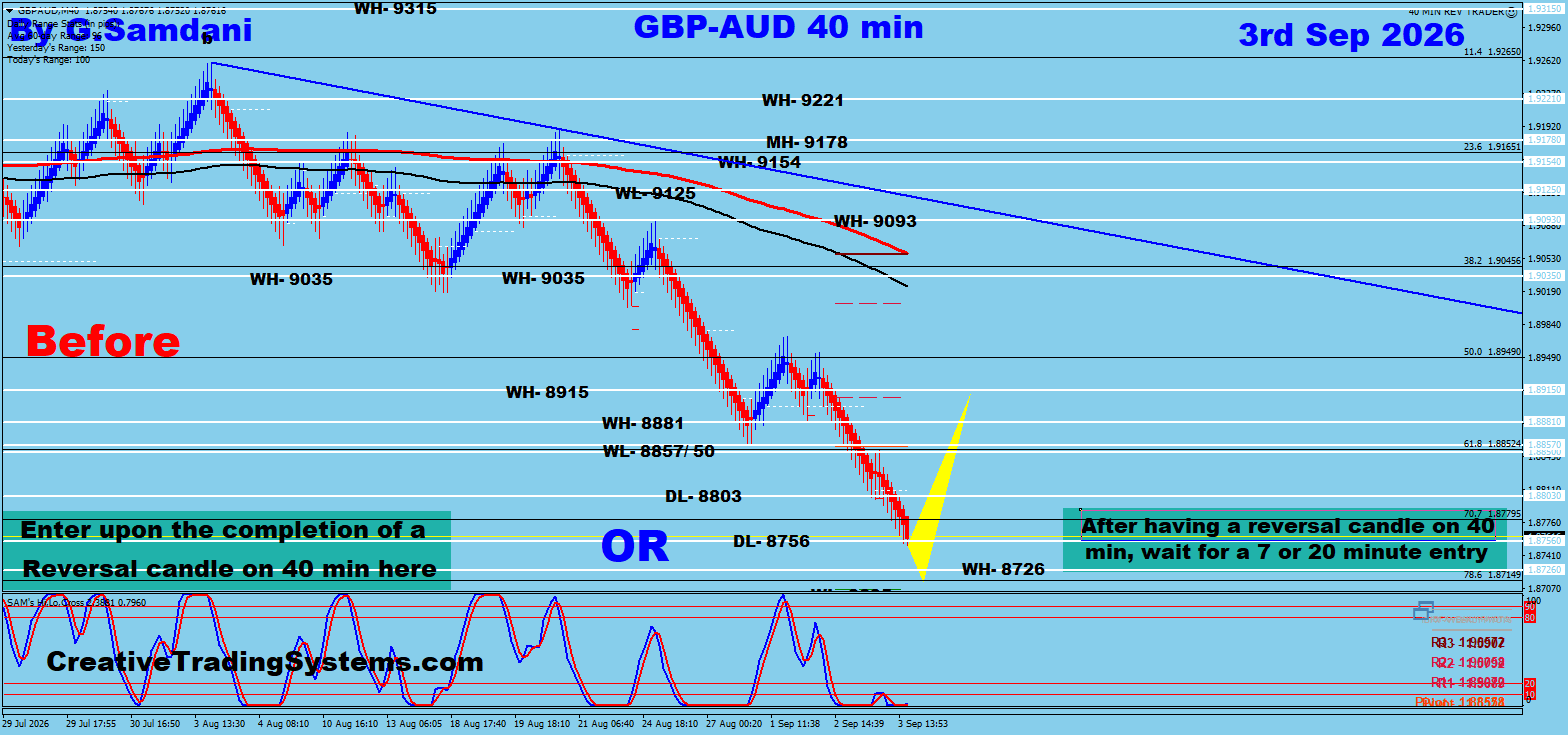
✅ Win
Before
September 3 — Marked-up analysis
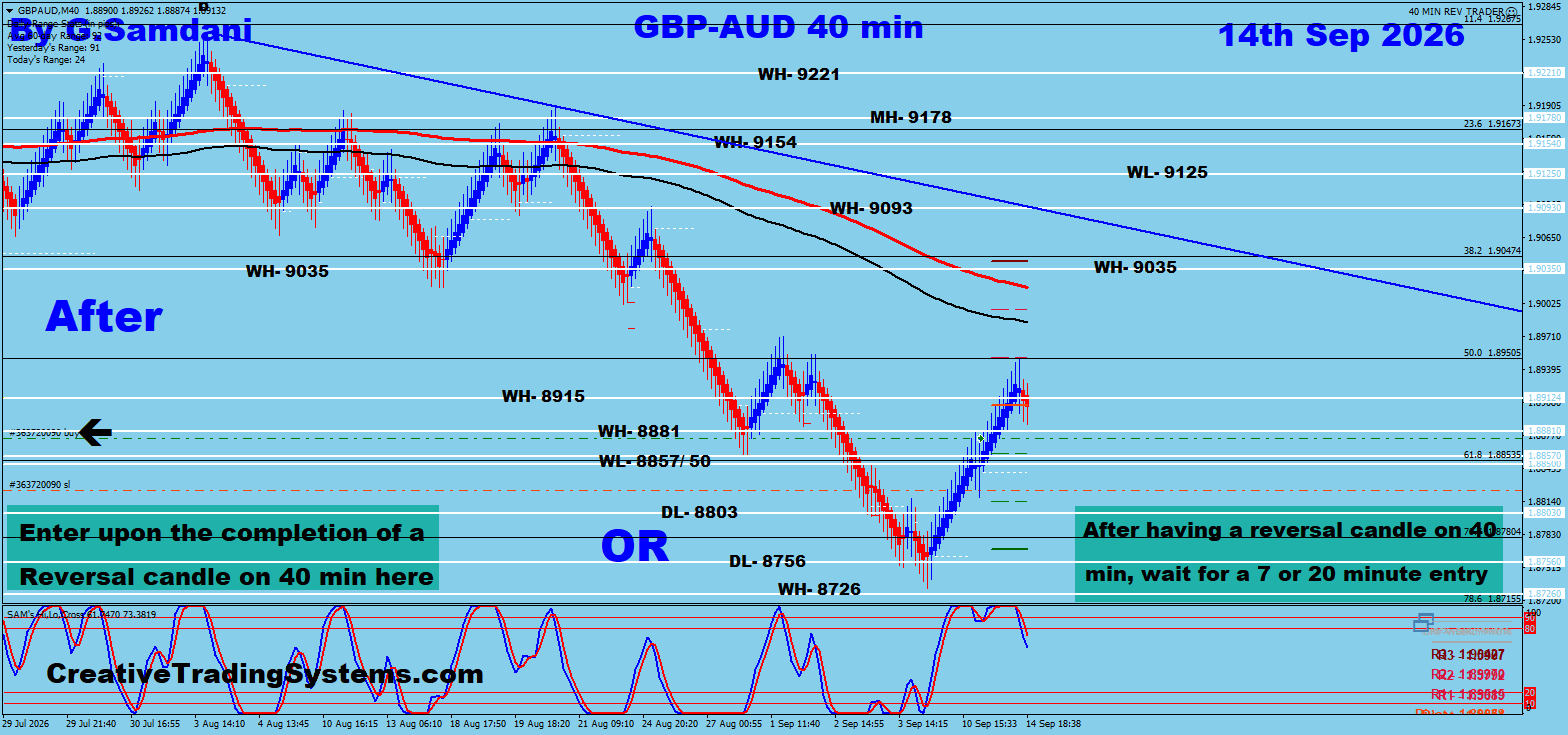
After
September 14 — Market outcome
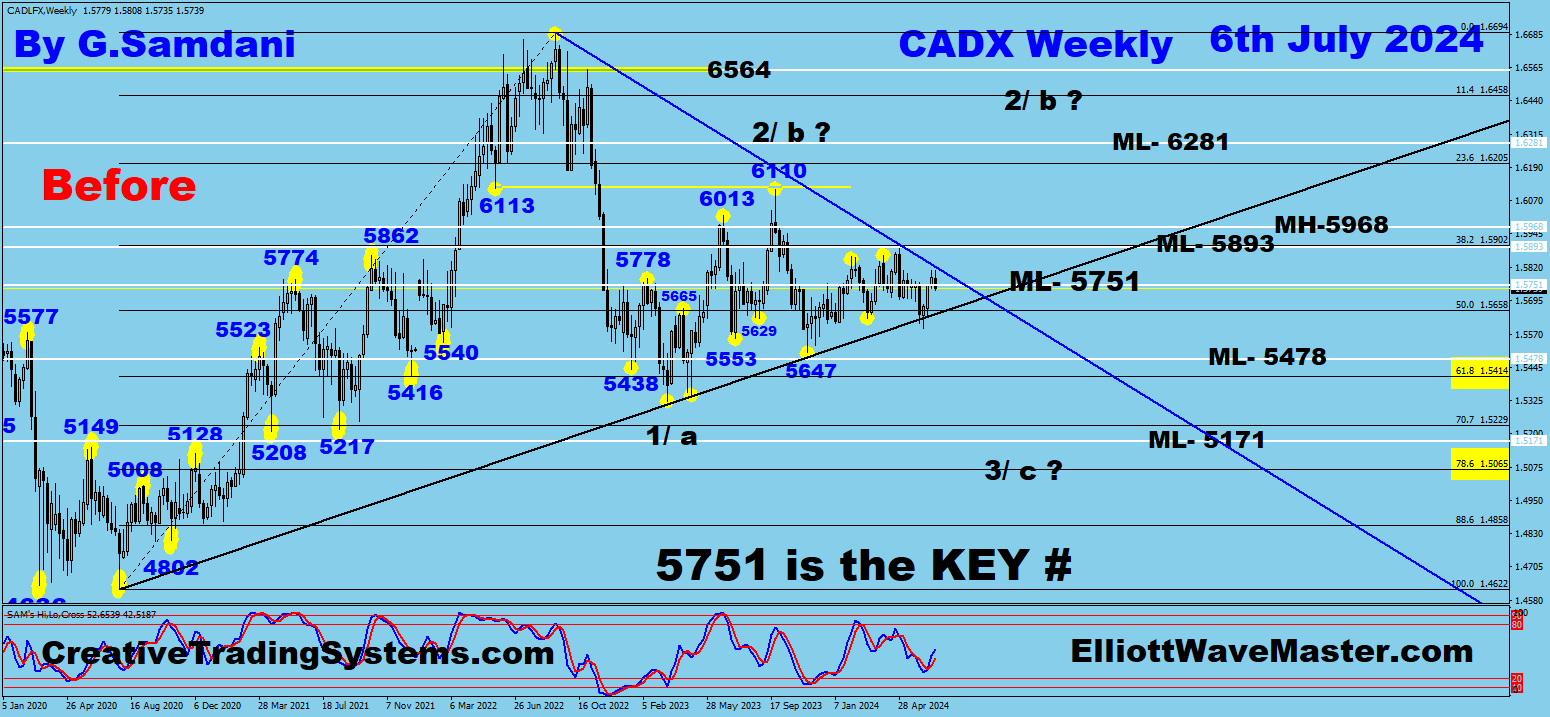
✅ Win
Before
July 6, 2024 — Marked-up analysis
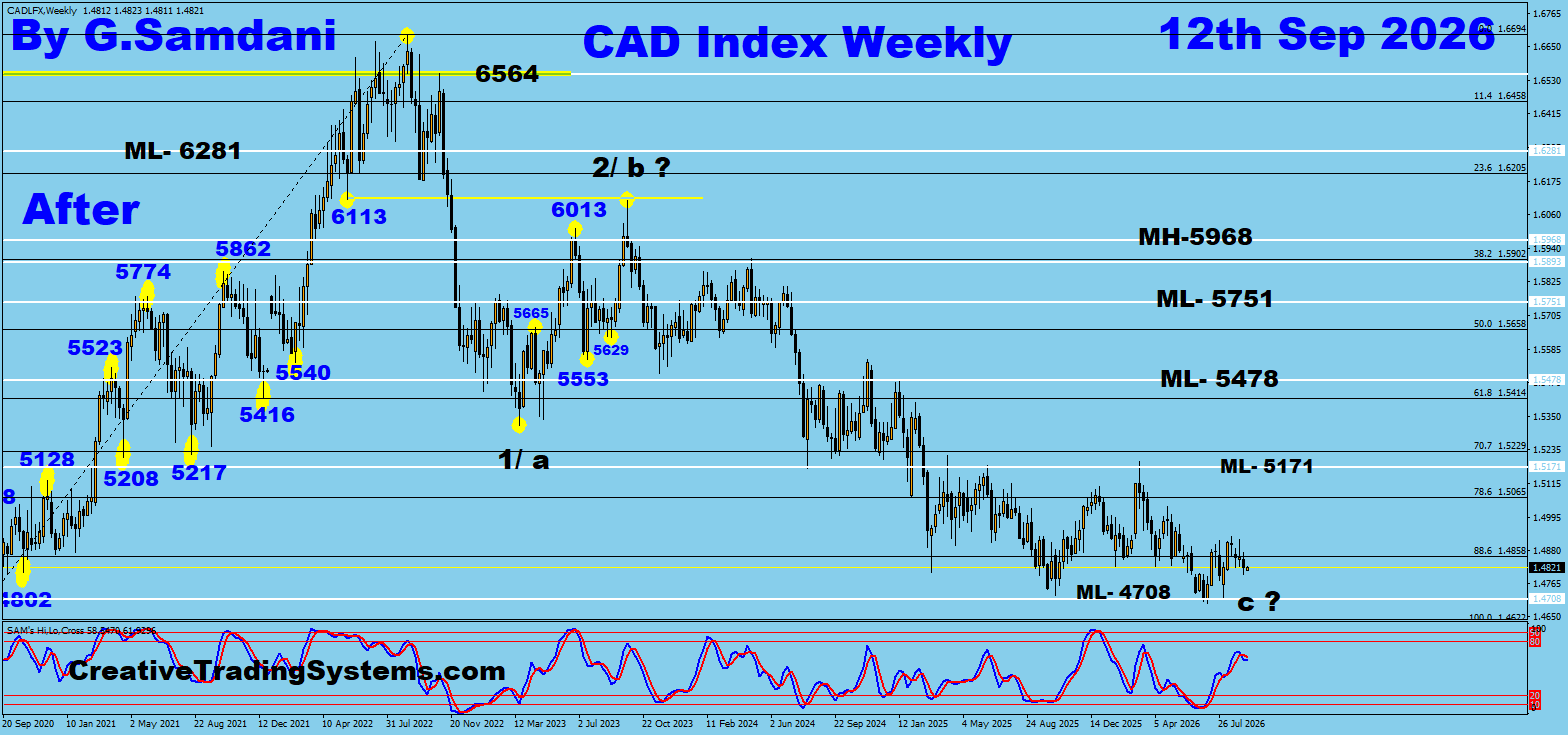
After
September 12, 2026 — Market outcome
✅ Win
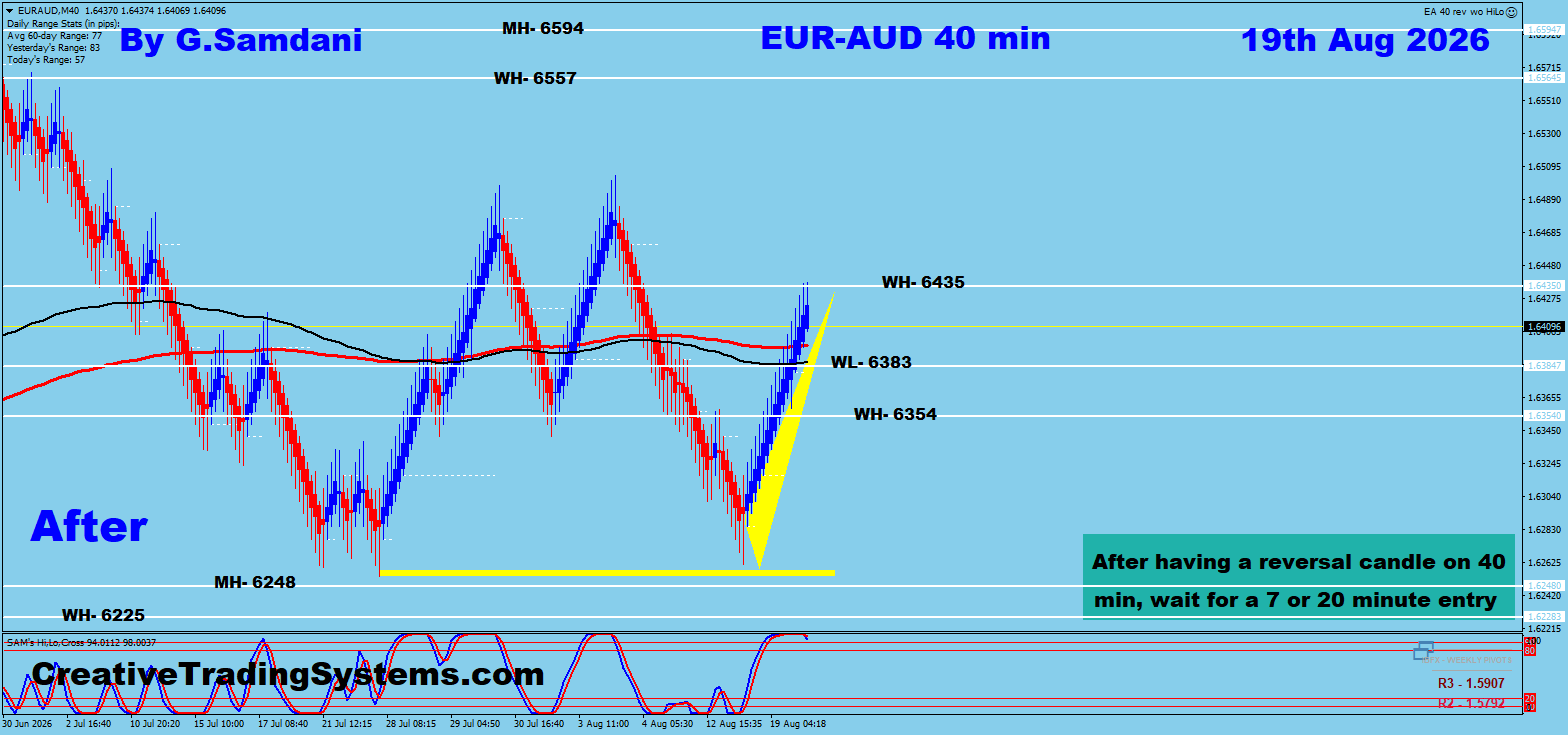
Before
August 17 — Marked-up analysis
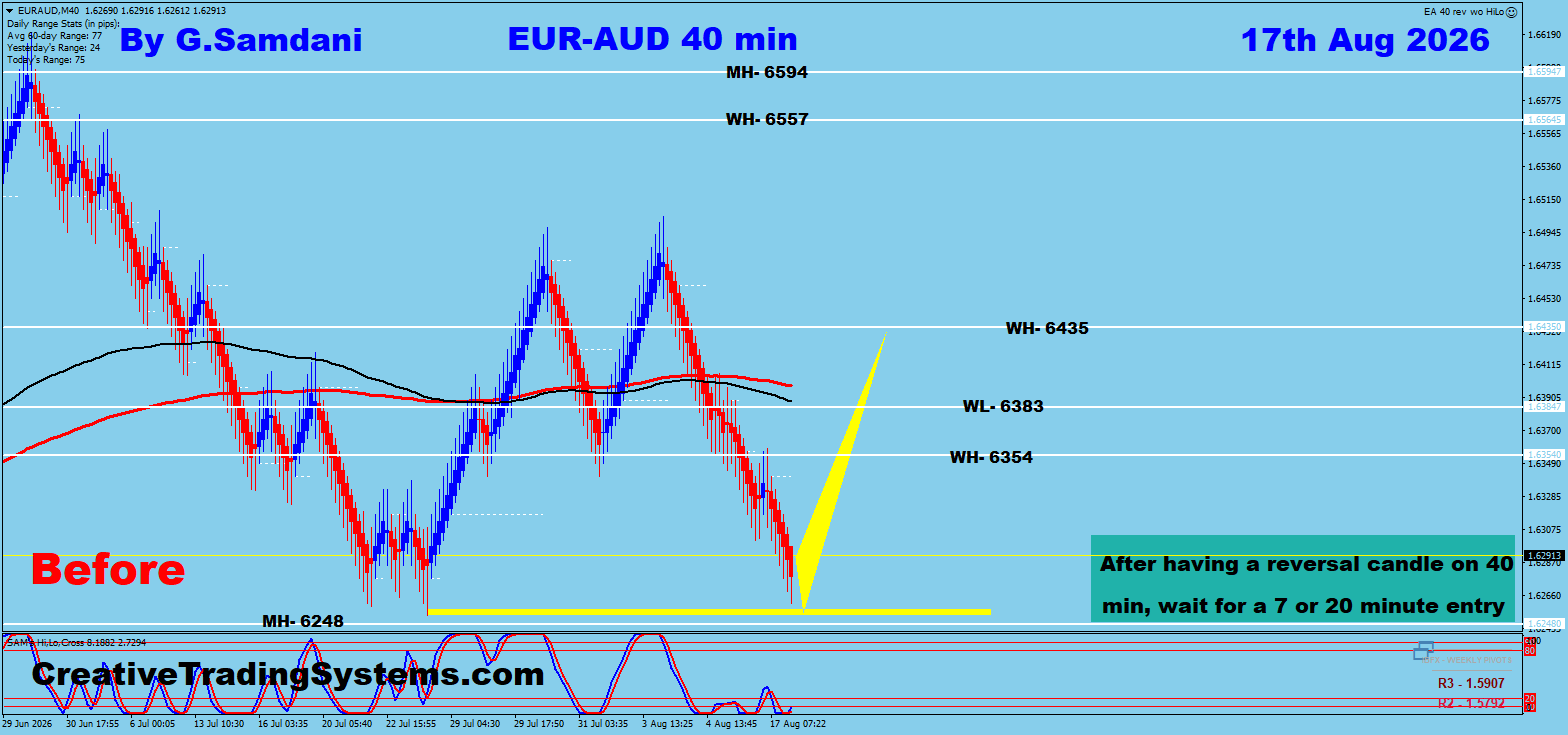
After
August 19 — Market outcome
✅ Win
Before
August 1 — Marked-up analysis
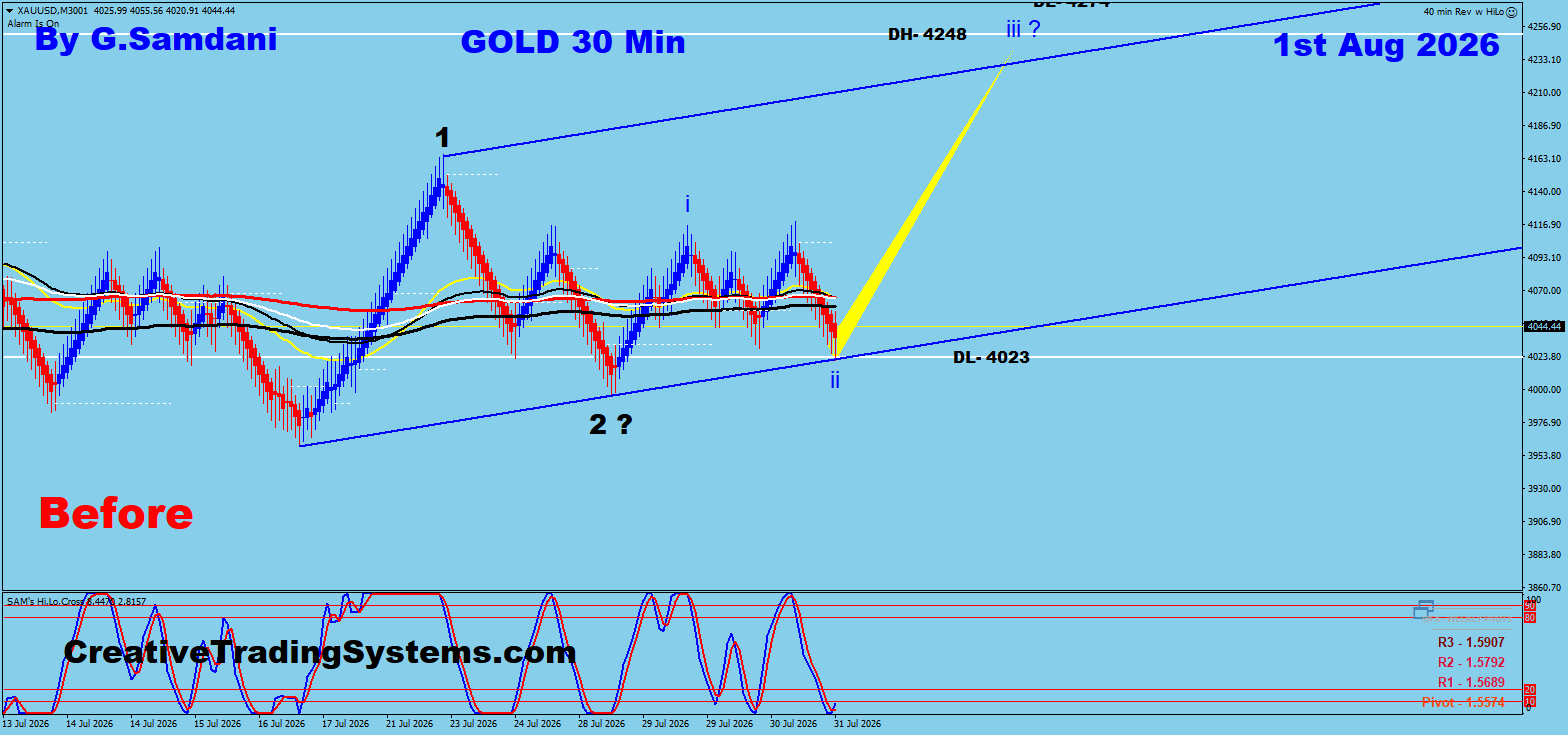
After
August 7 — Market outcome
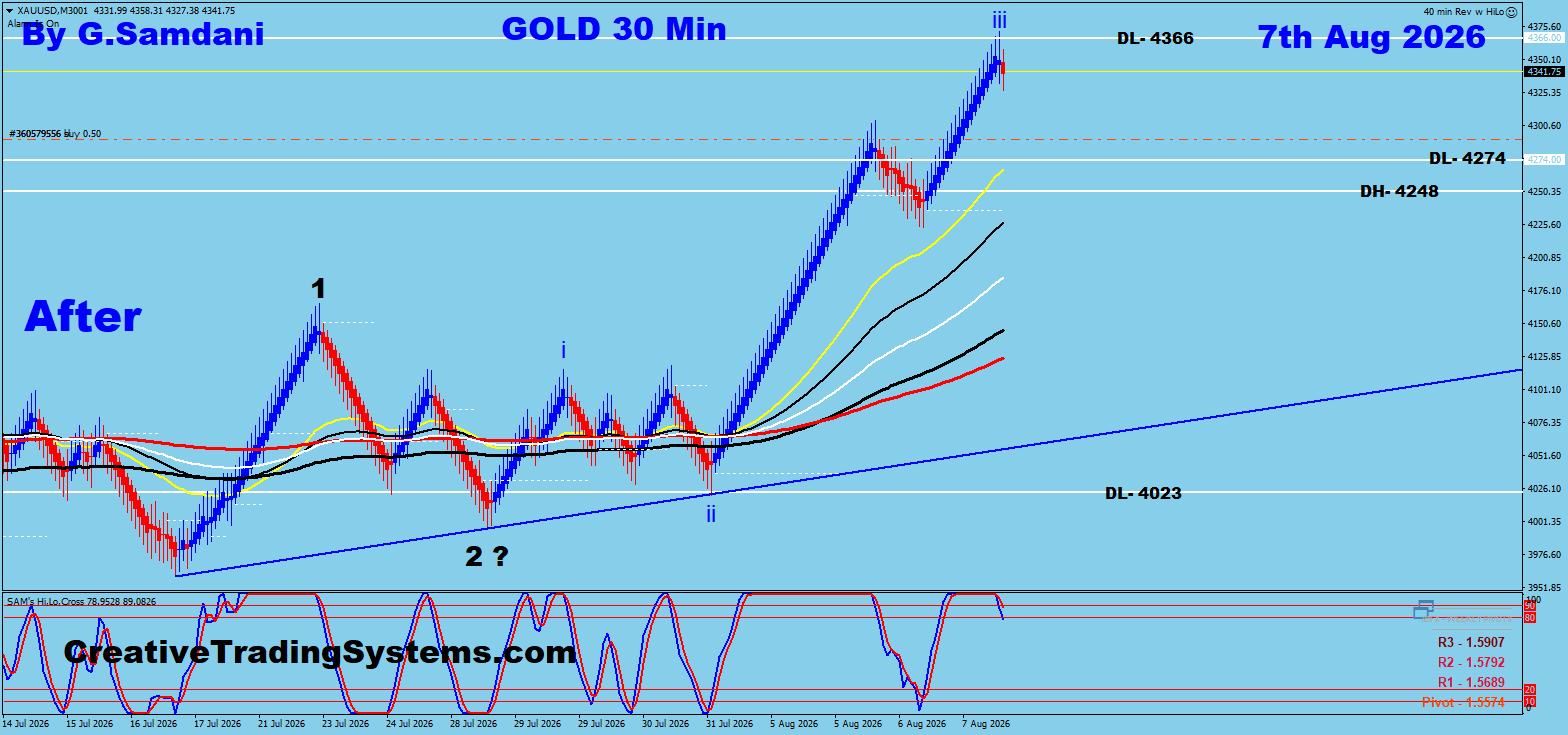
📈 Trades Taken
Gold — 500 Renko · August 4 & 500 Renko · August 7
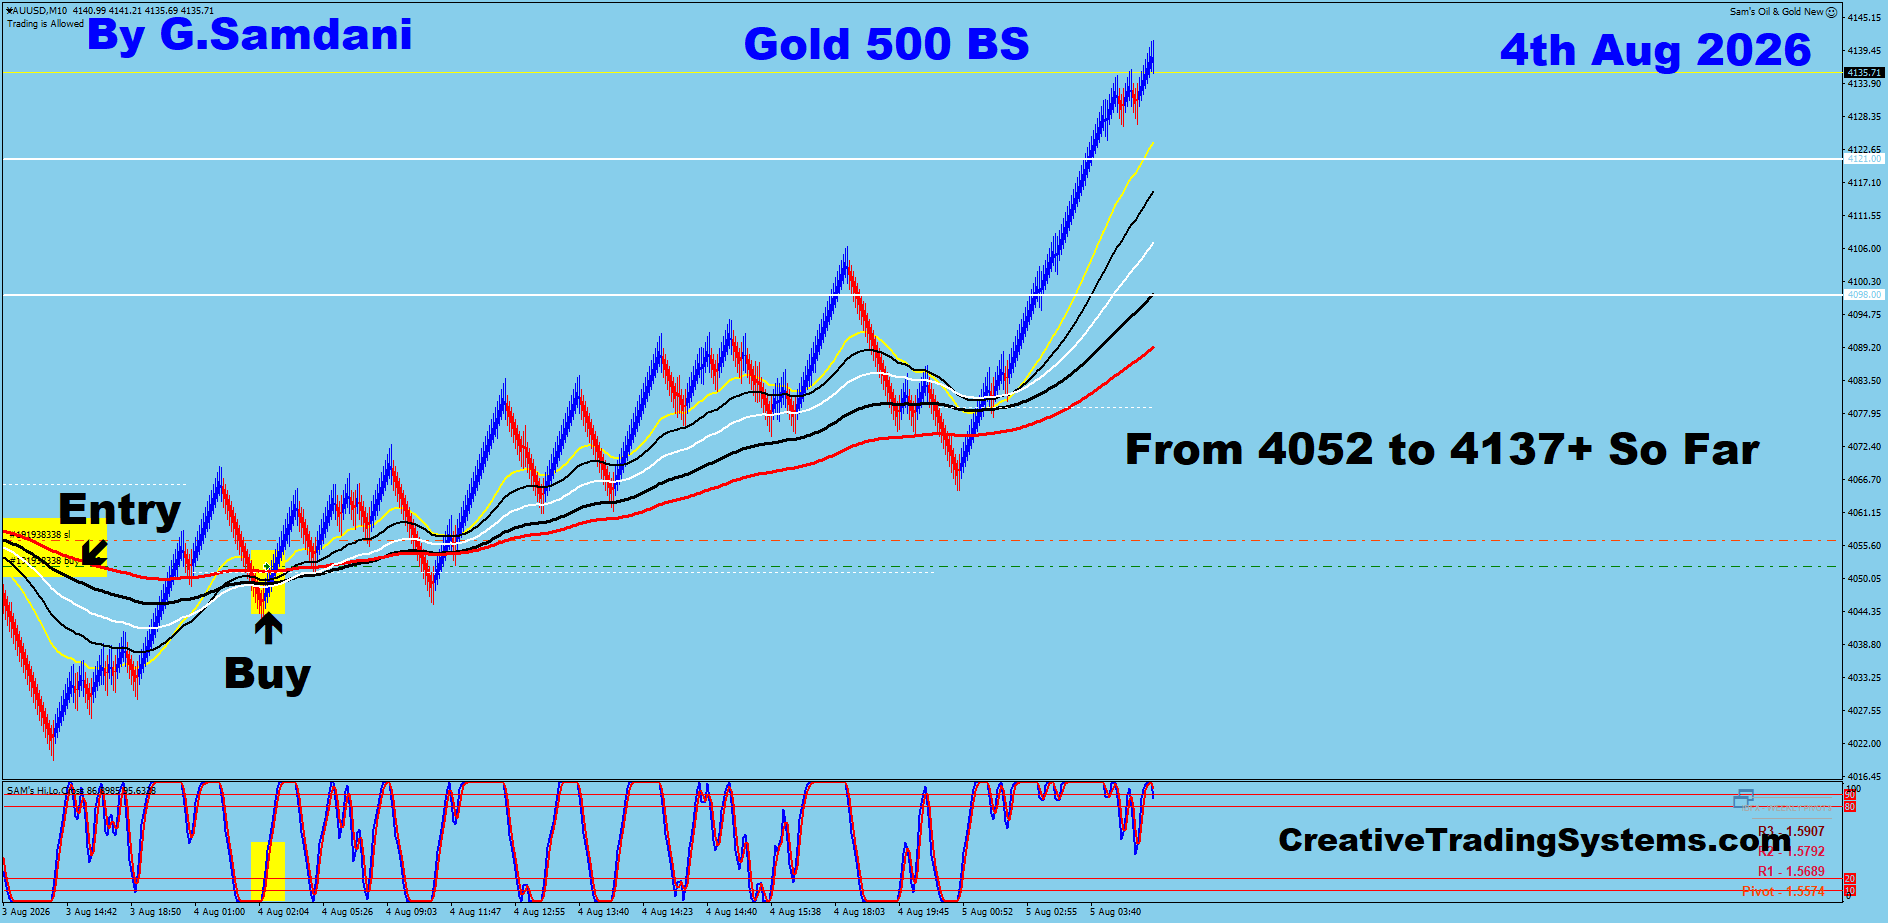
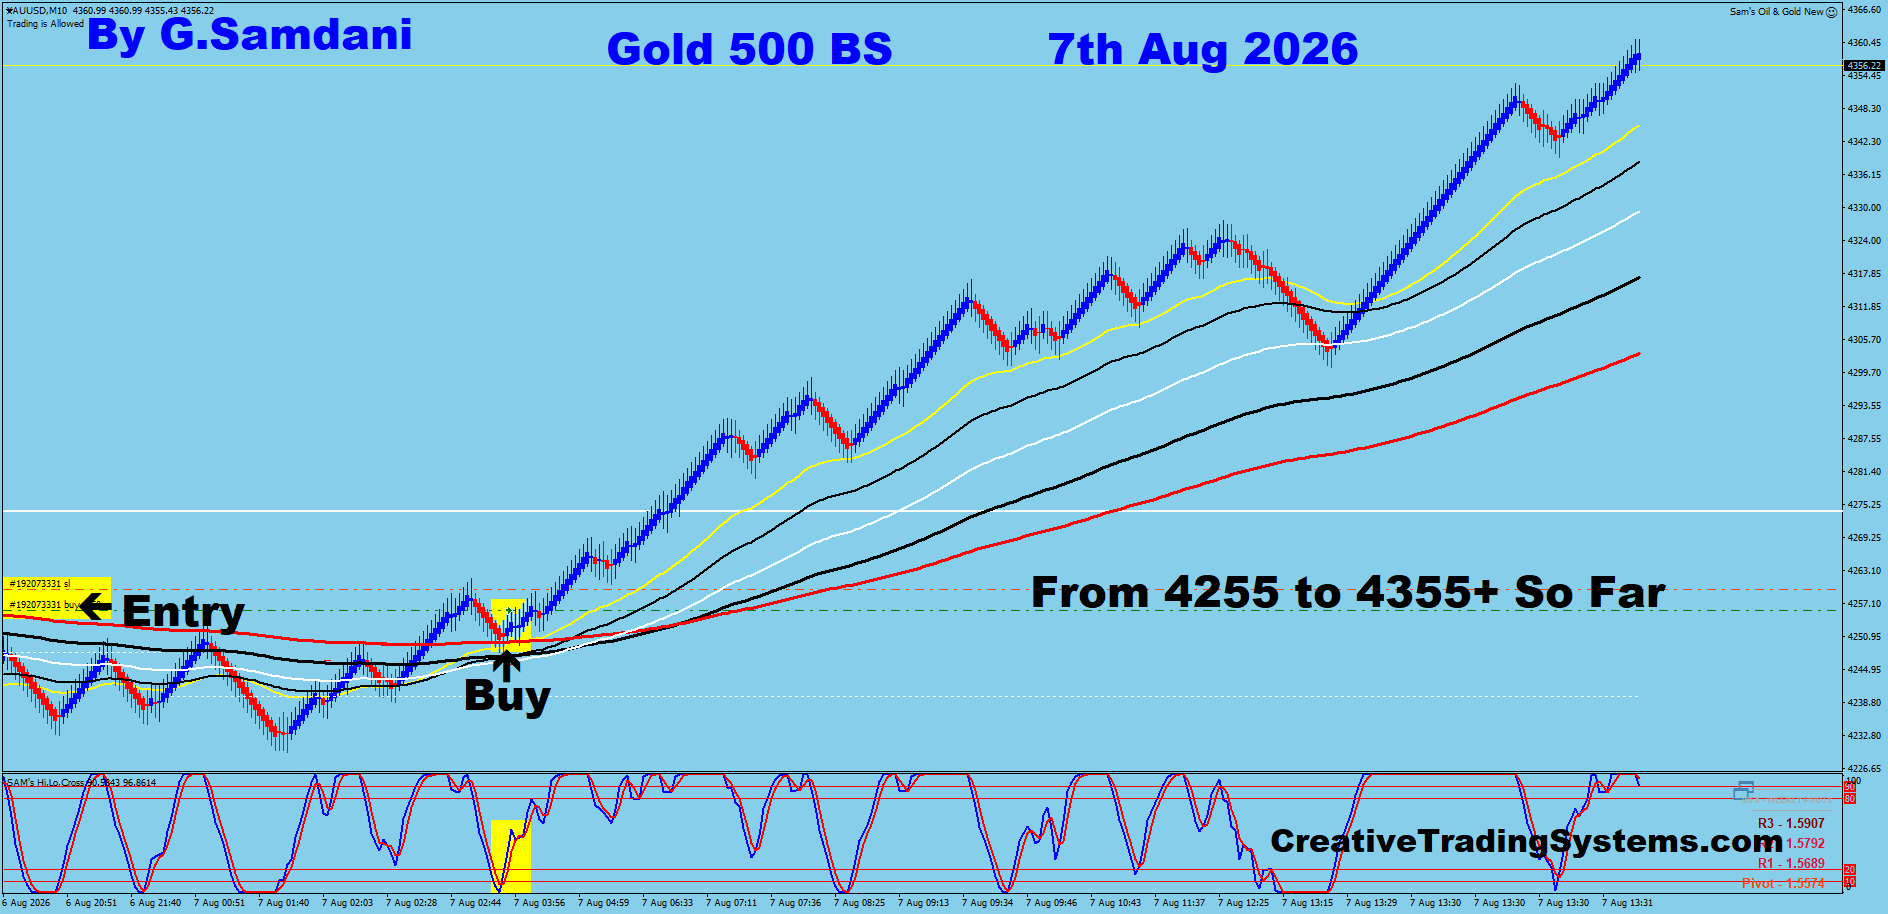
✅ Win
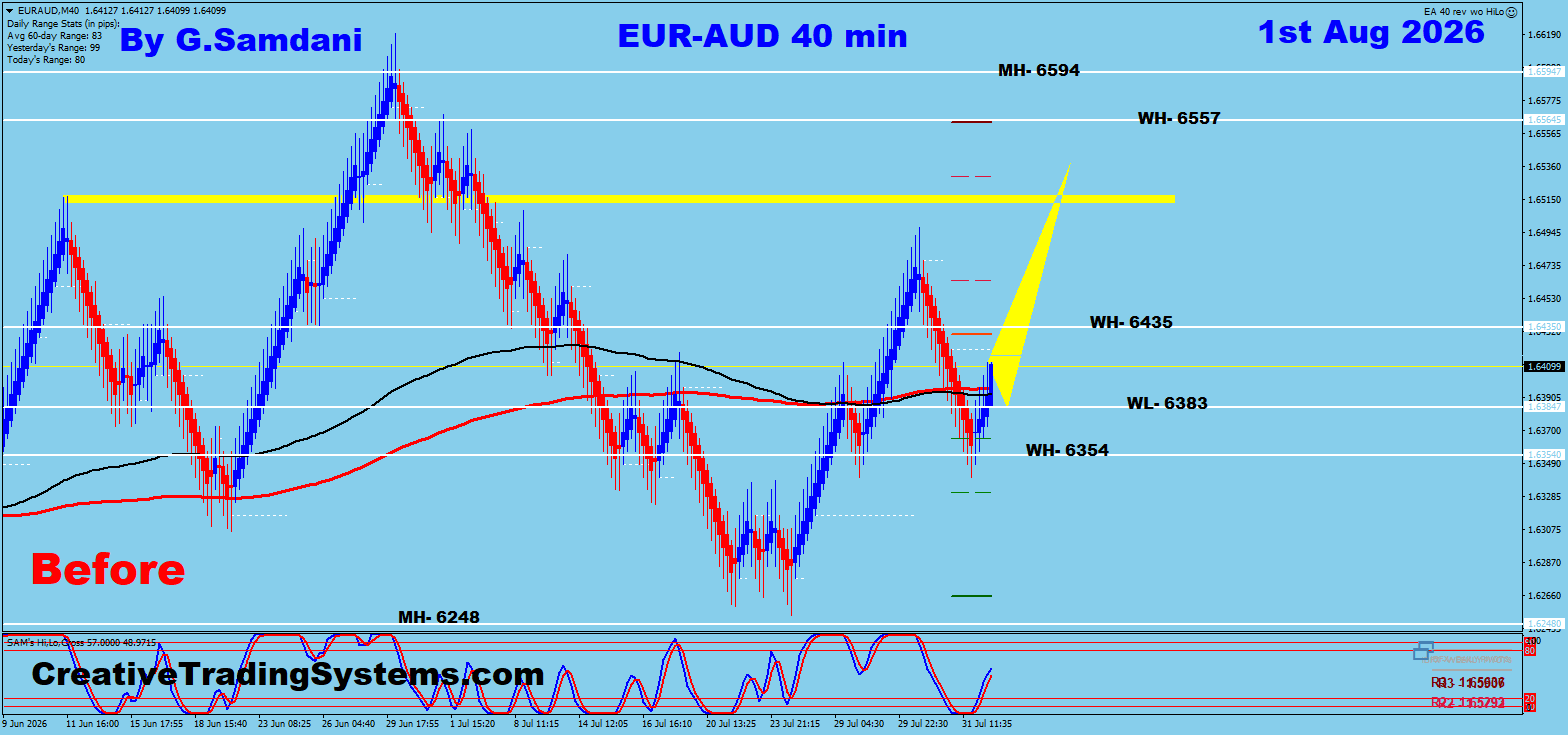
Before
August 1 — Marked-up analysis
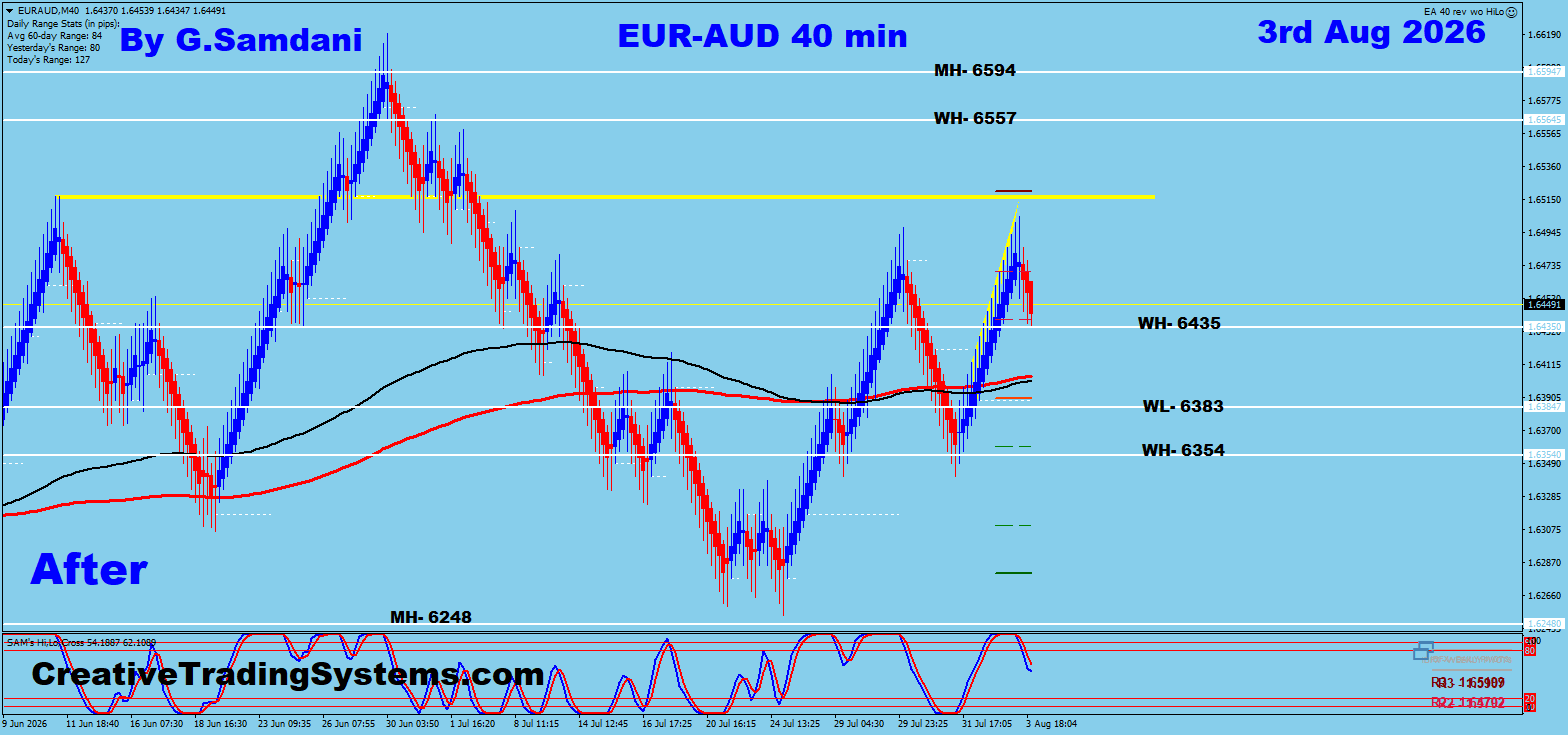
After
August 3 — Market outcome
✅ Win
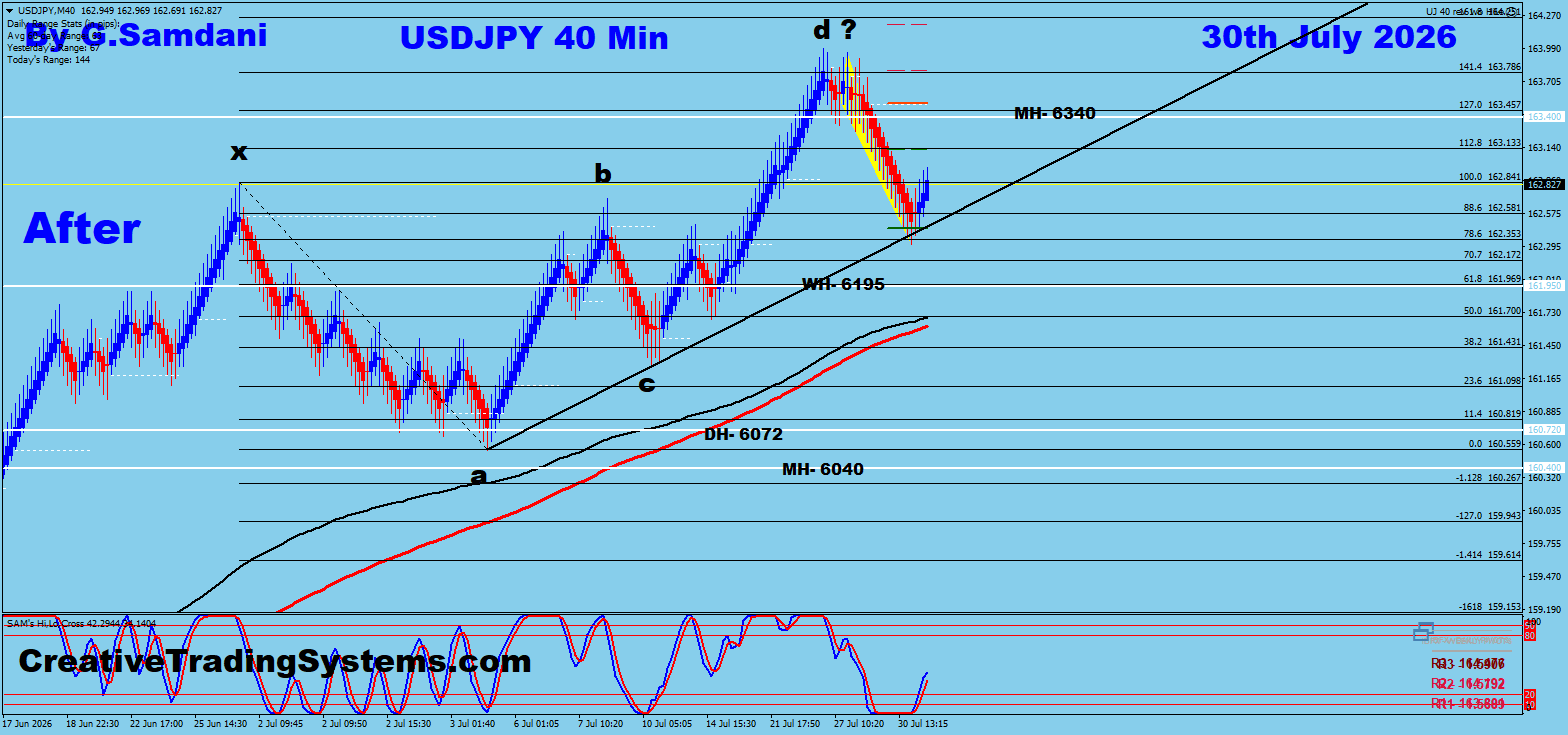
Before
July 27 — Marked-up analysis
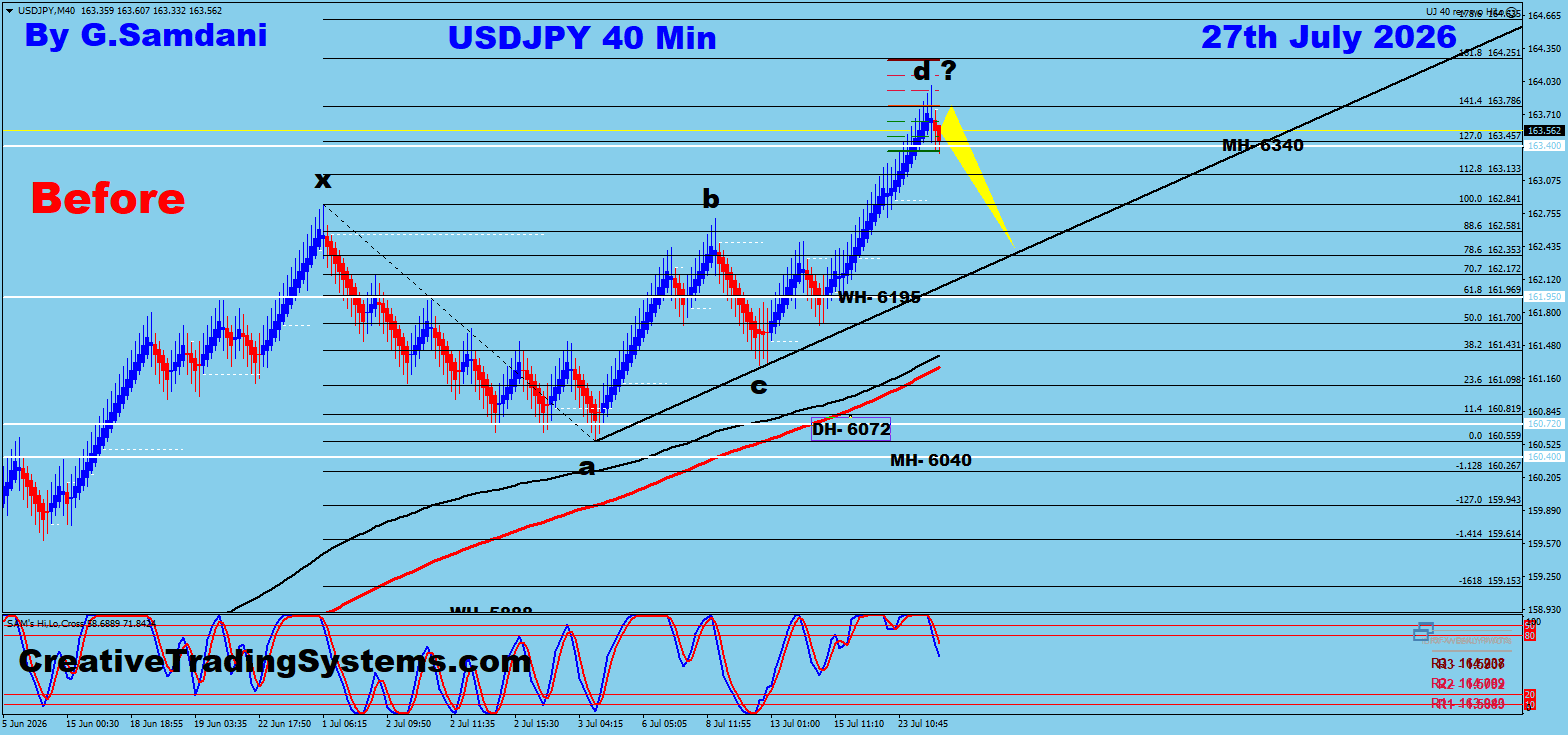
After
July 30 — Market outcome
✅ Win
Before
July 25 — Marked-up analysis
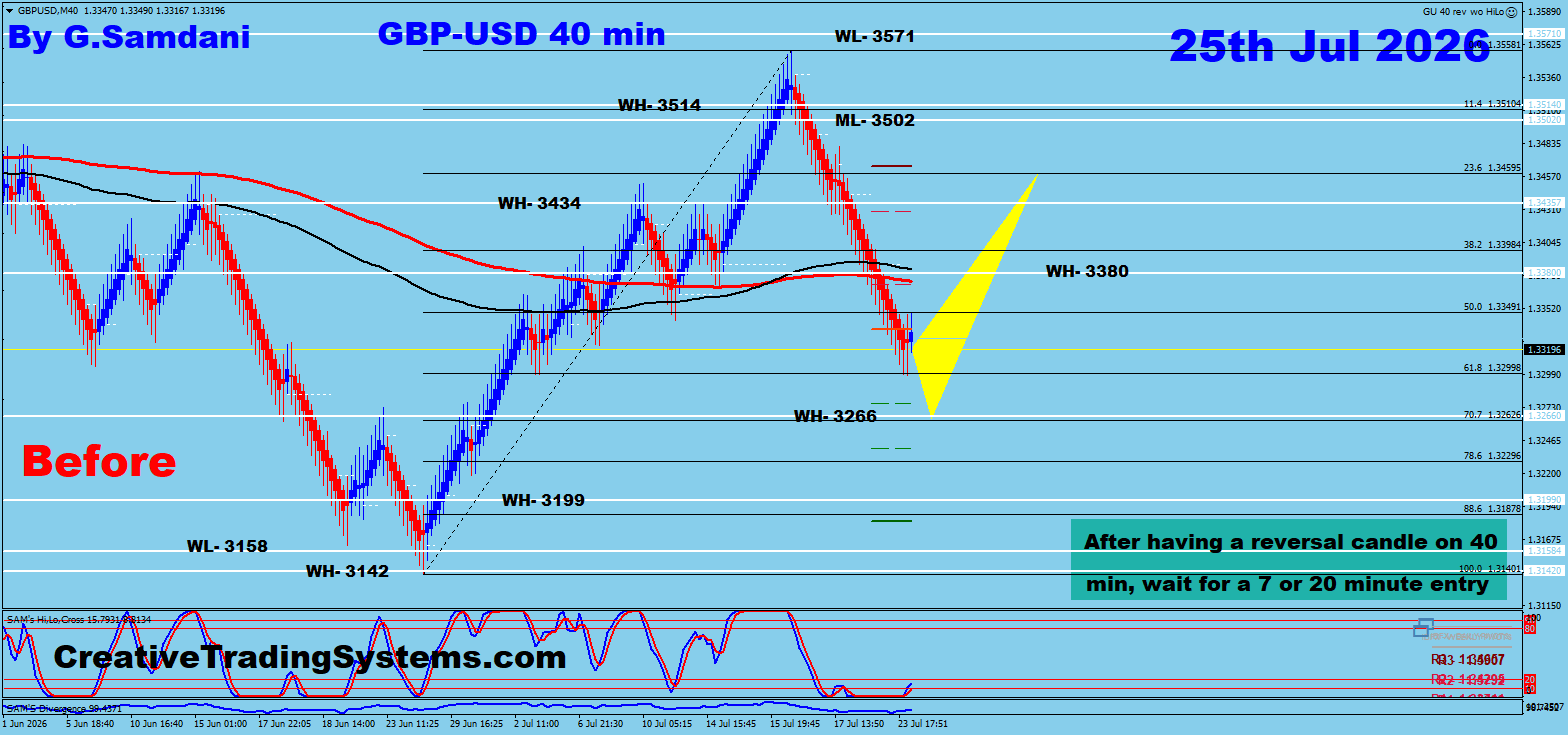
After
July 30 — Market outcome

✅ Win
Before
July 27 — Marked-up analysis
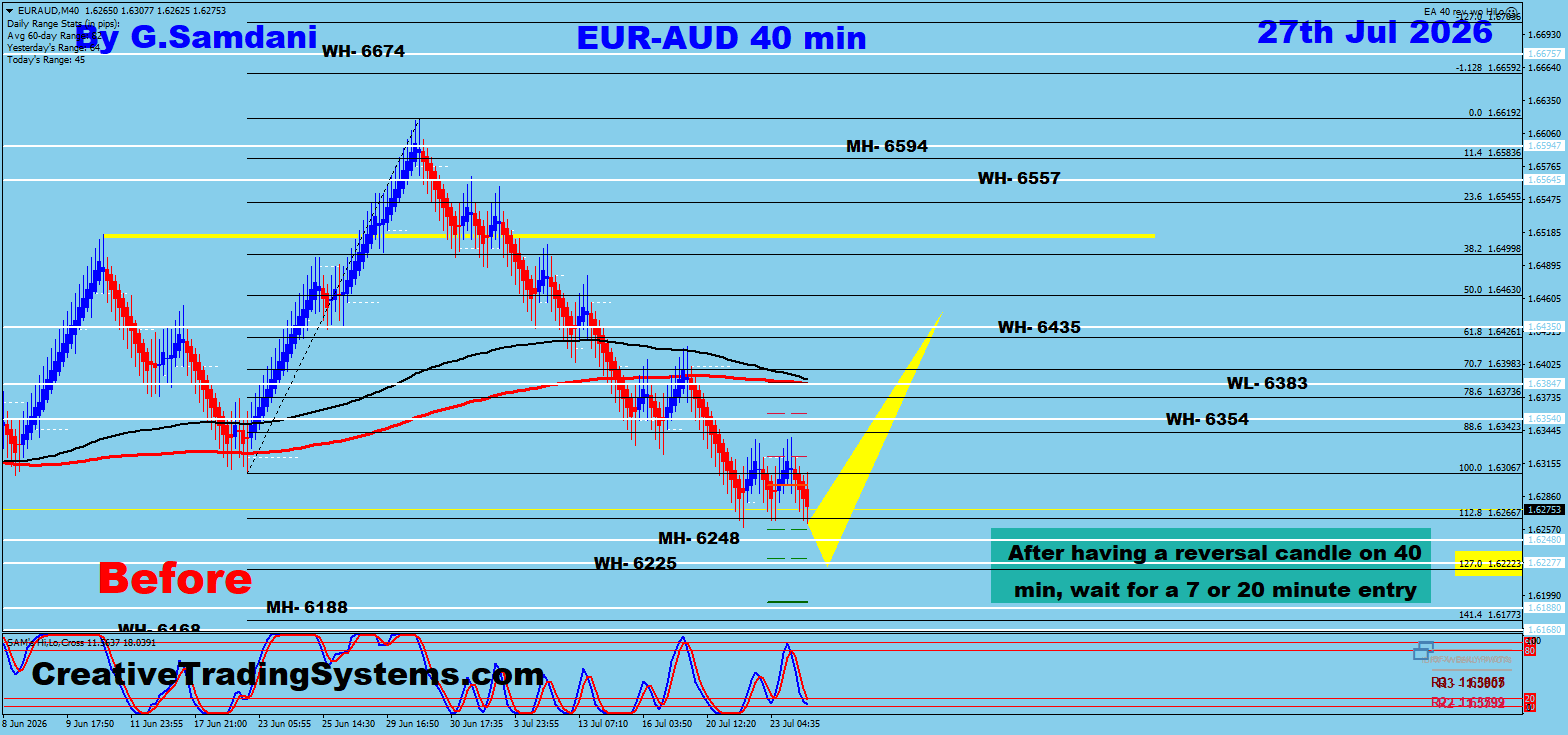
After
July 29 — Market outcome
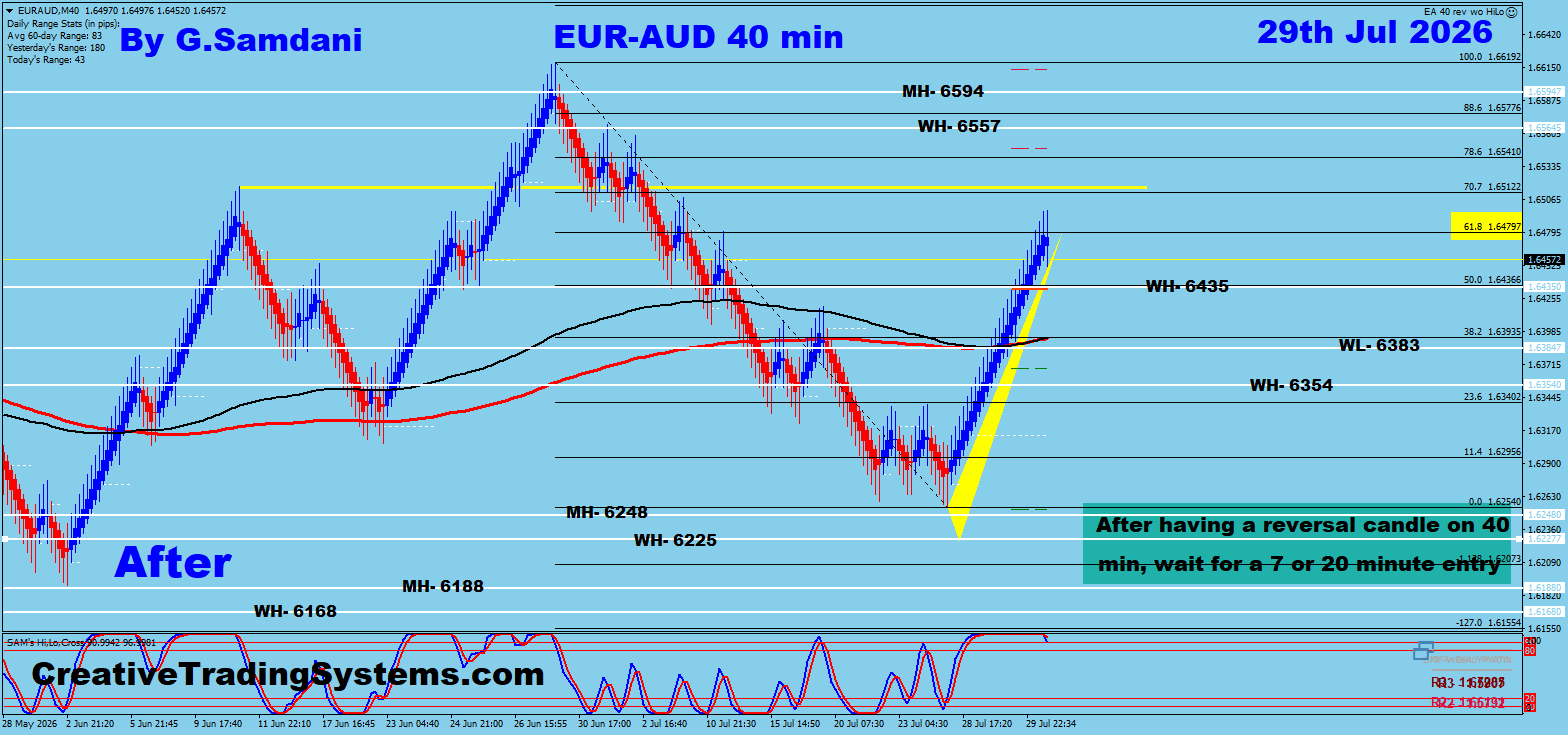
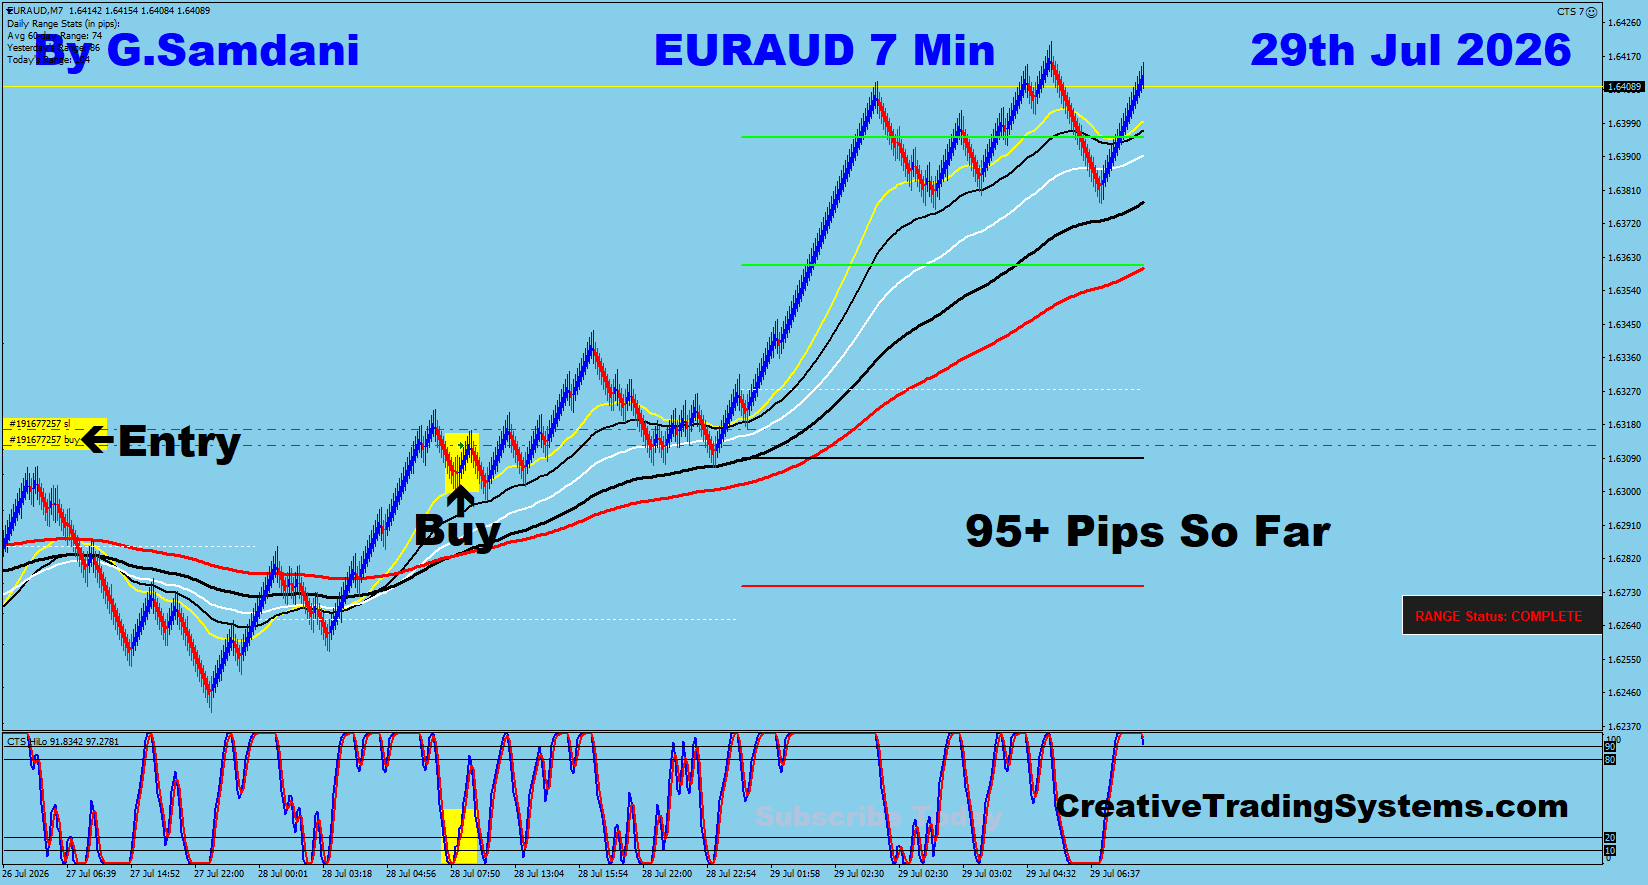
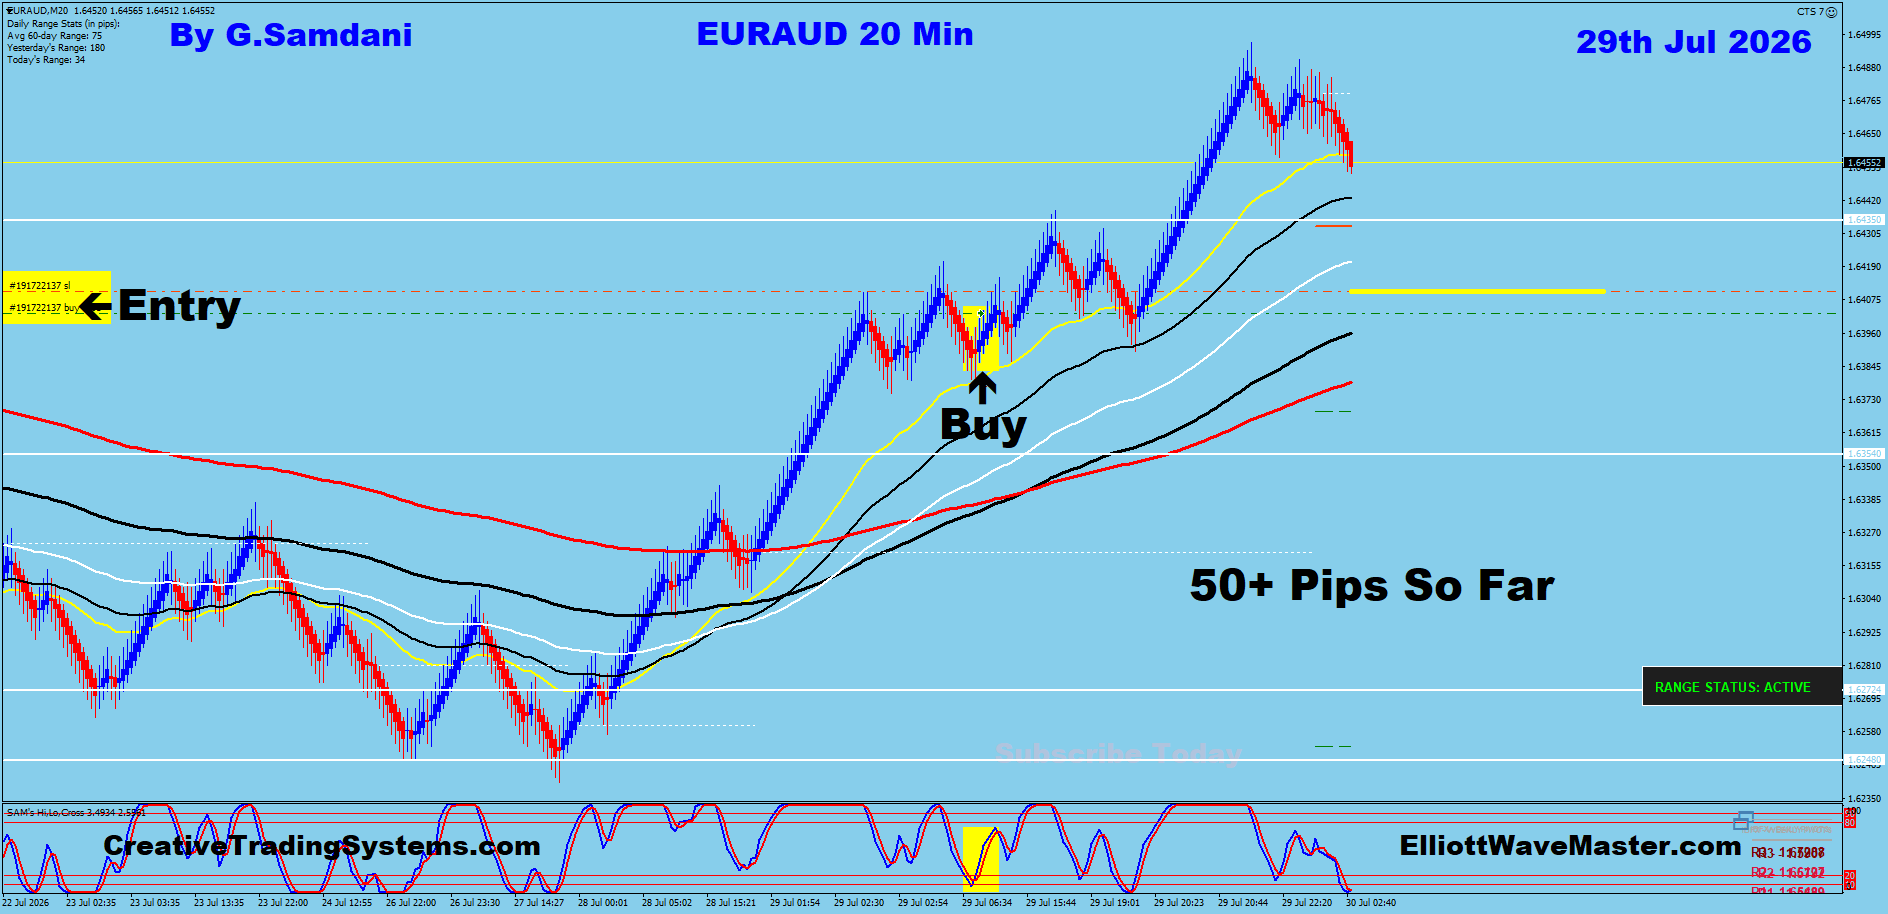
📈 Trades Taken
EUR/AUD — 7 Min & 20 Min Entries · July 29
✅ Win
Before
July 27 — Marked-up analysis
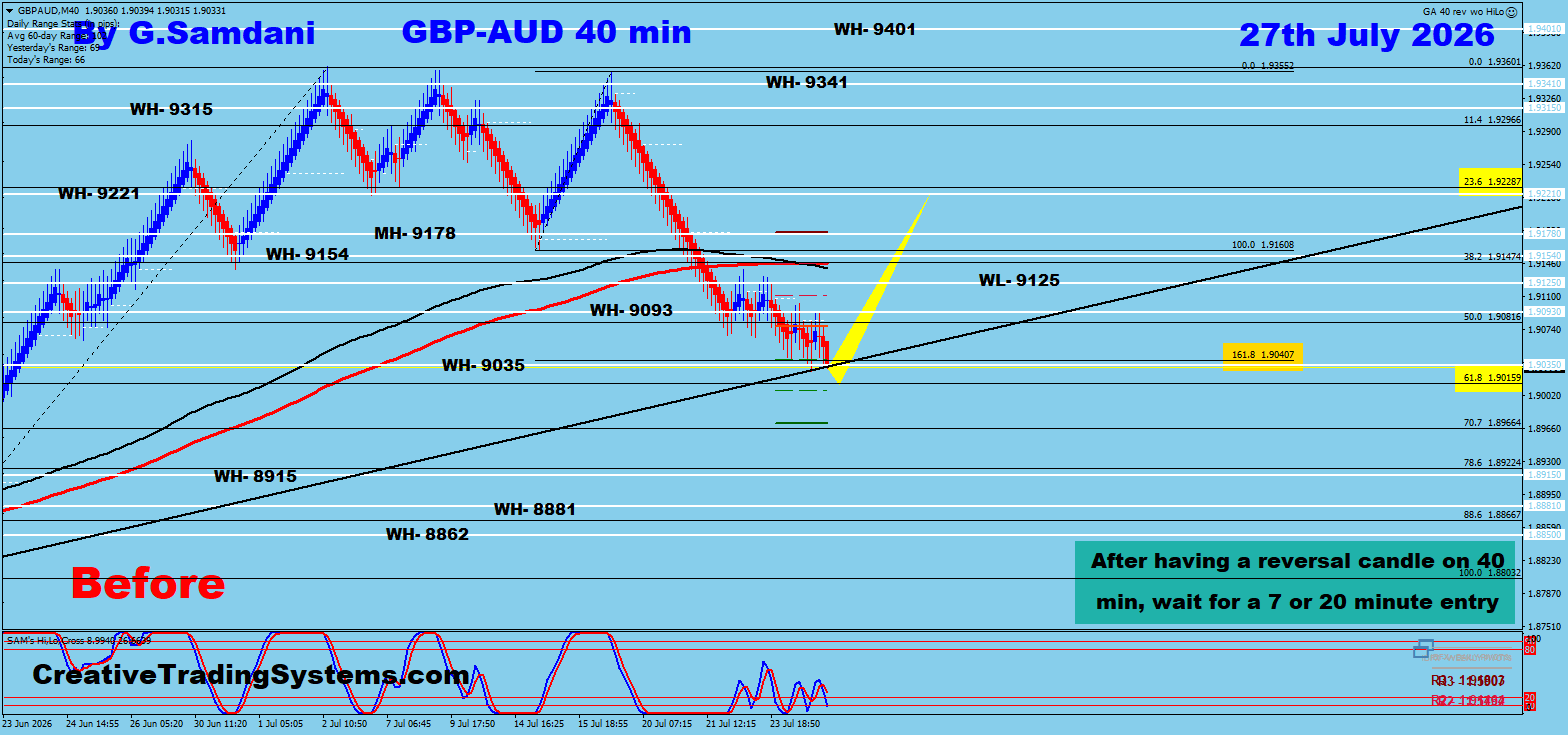
After
July 29 — Market outcome
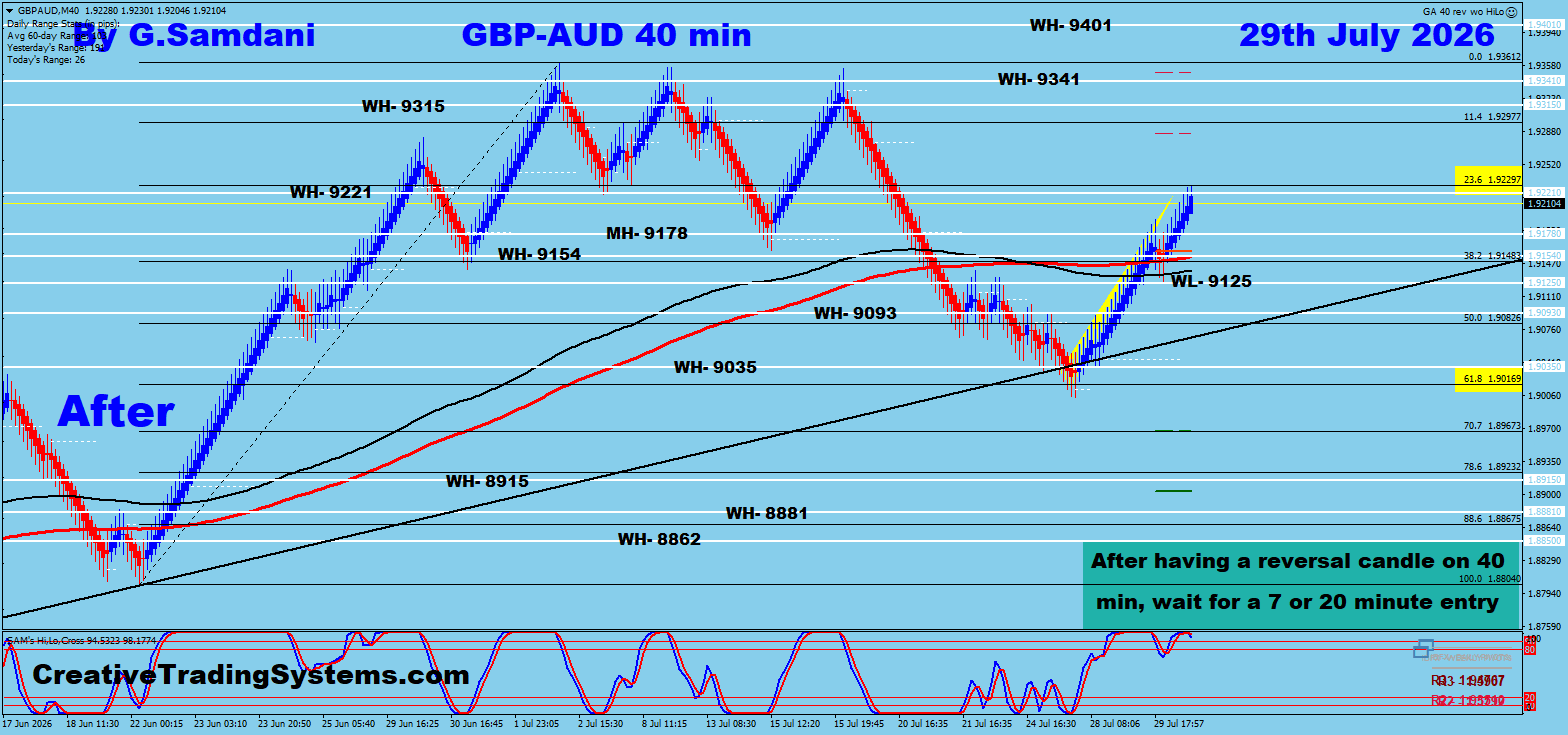
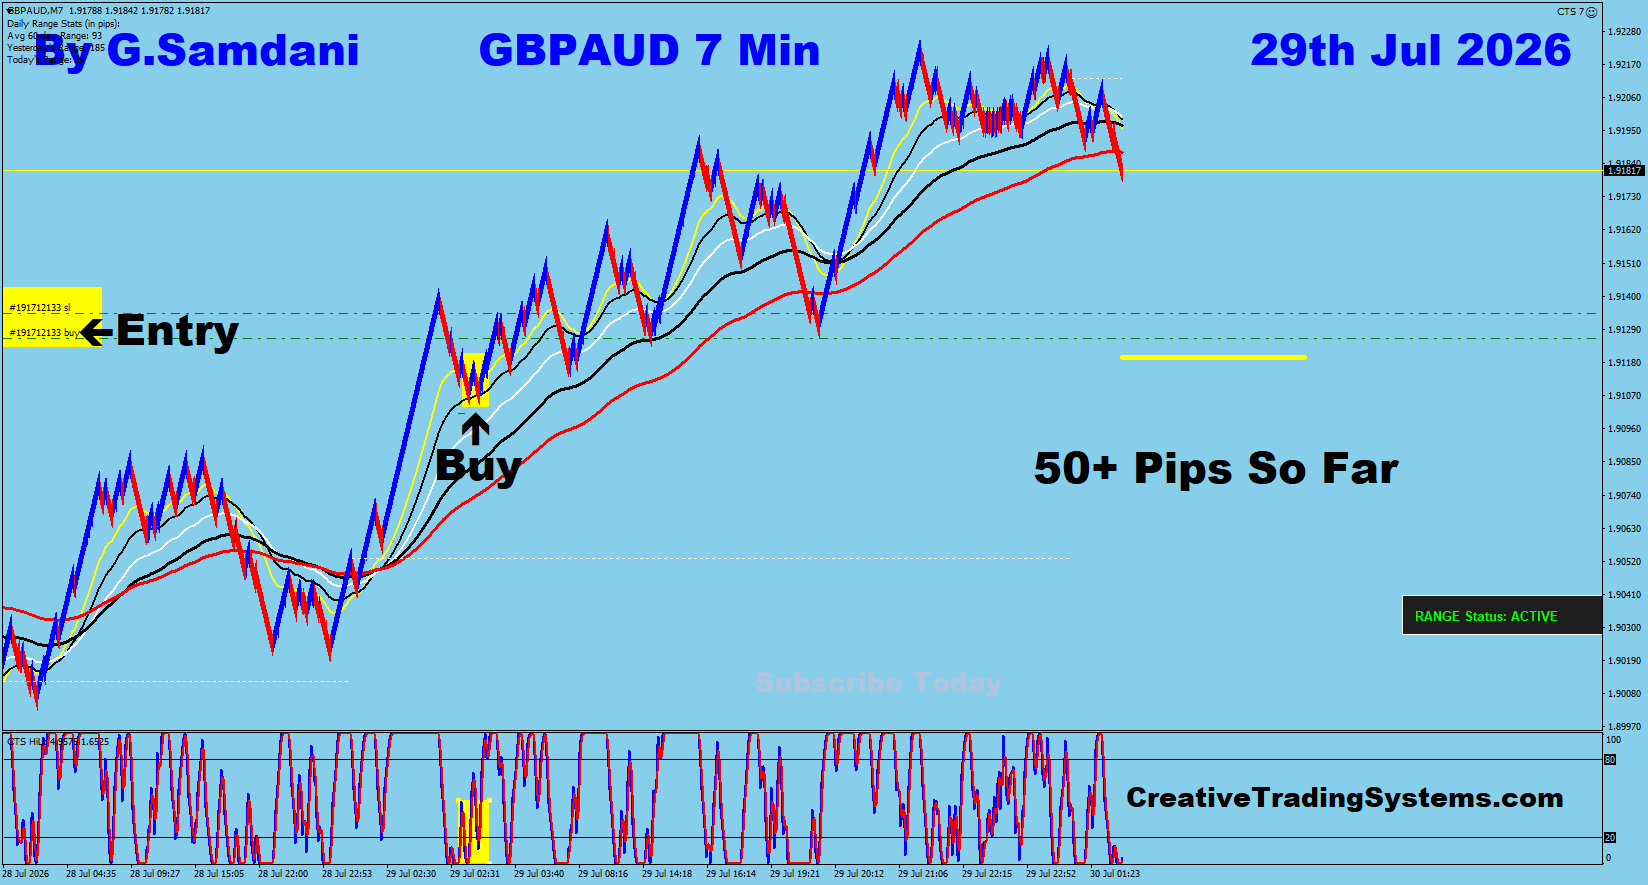
📈 Trade Taken
GBP/AUD — 7 Min Entry · July 29
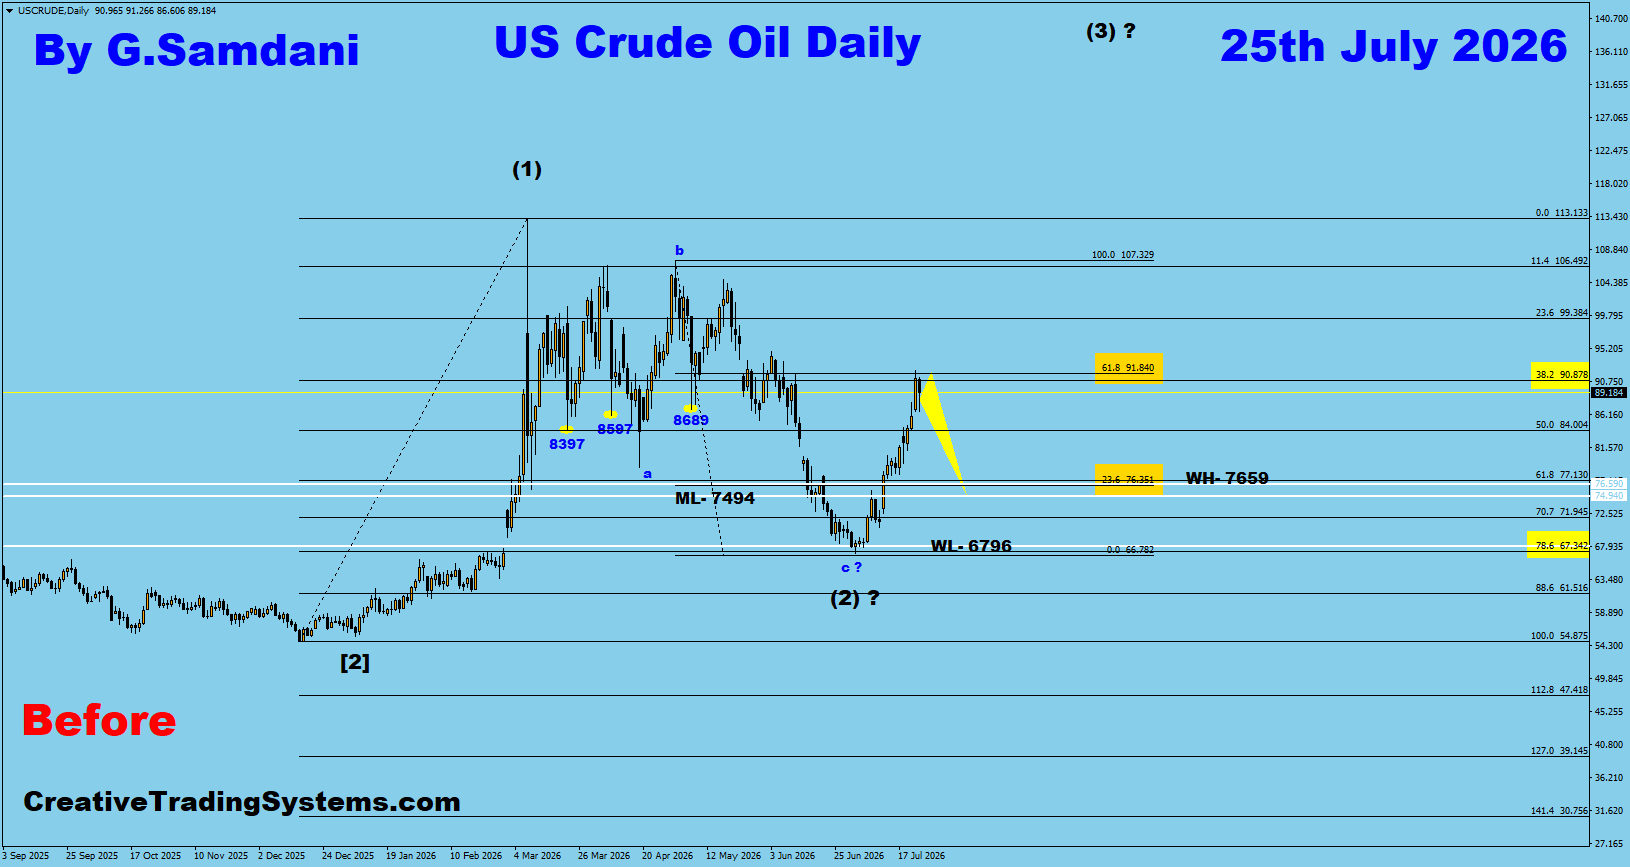
✅ Win
Before
July 25 — Marked-up analysis
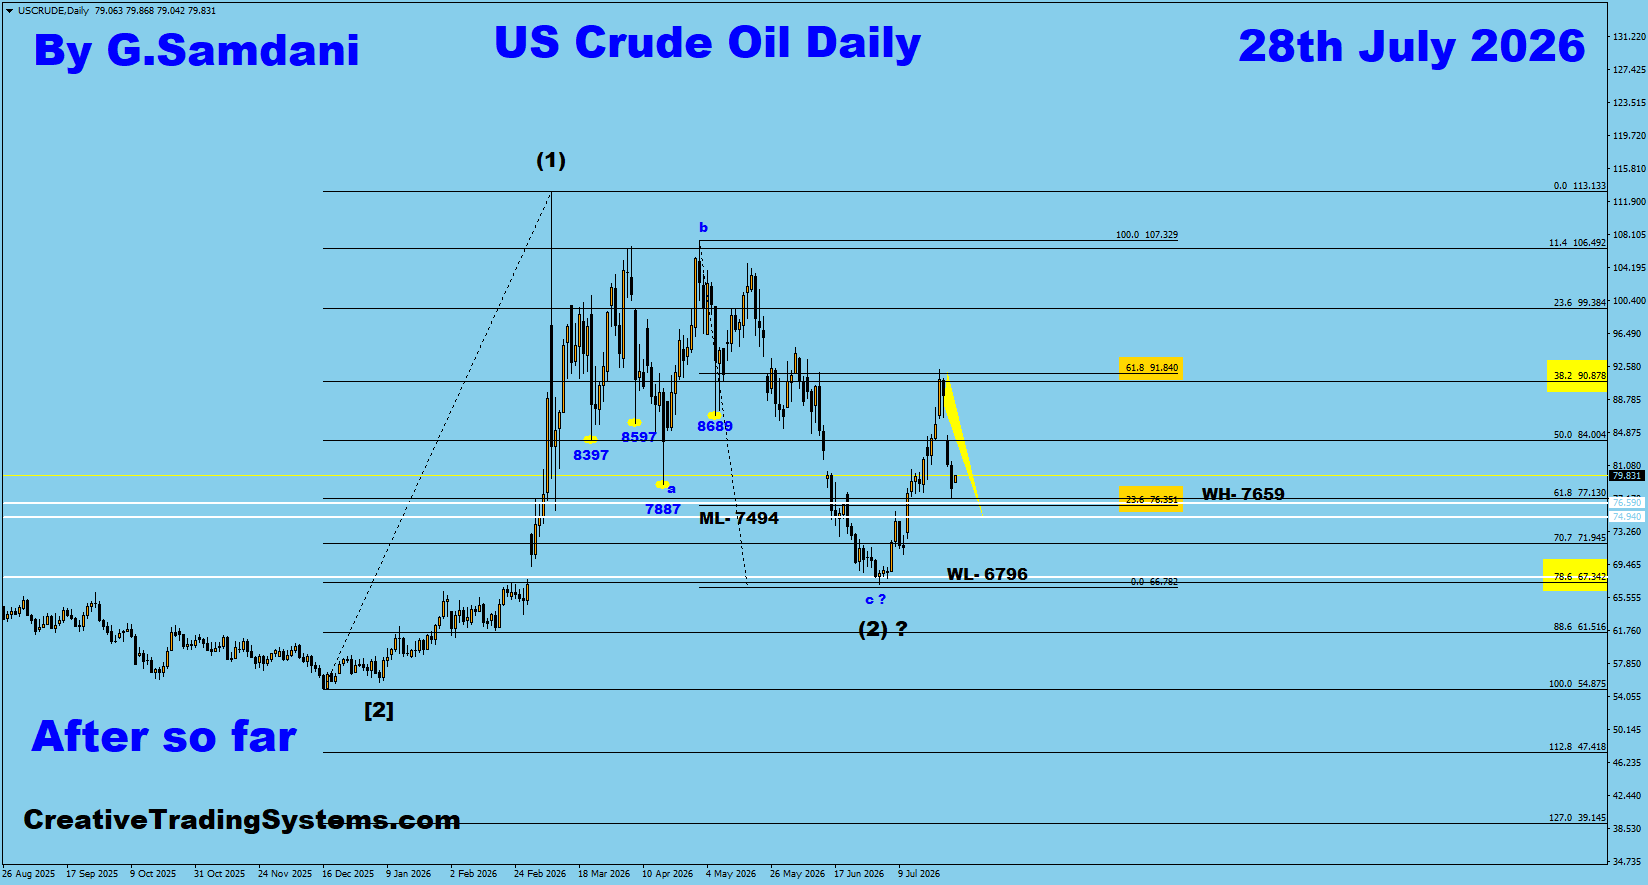
After
July 28 — Market outcome
✅ Win
Before
July 12 — Marked-up analysis
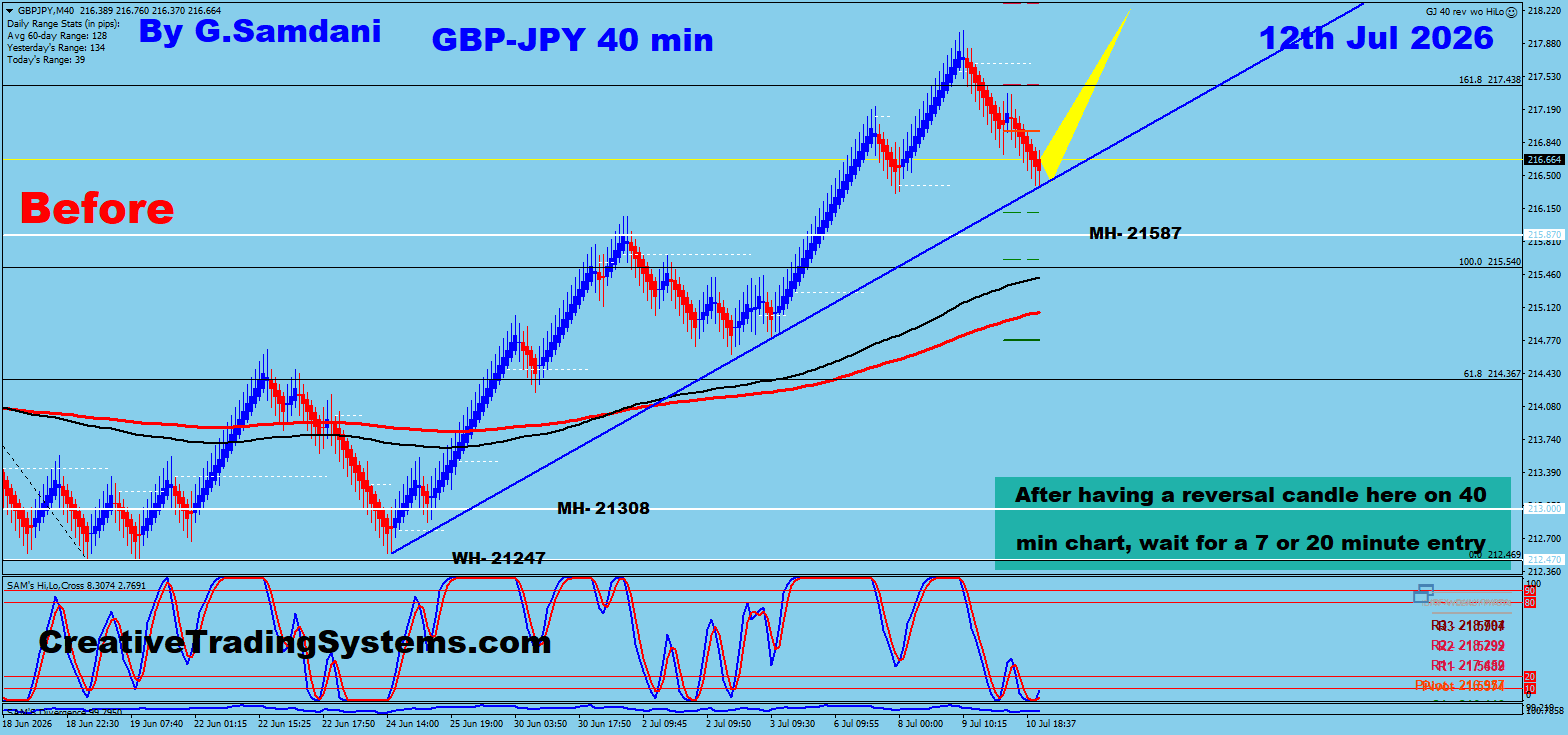
After
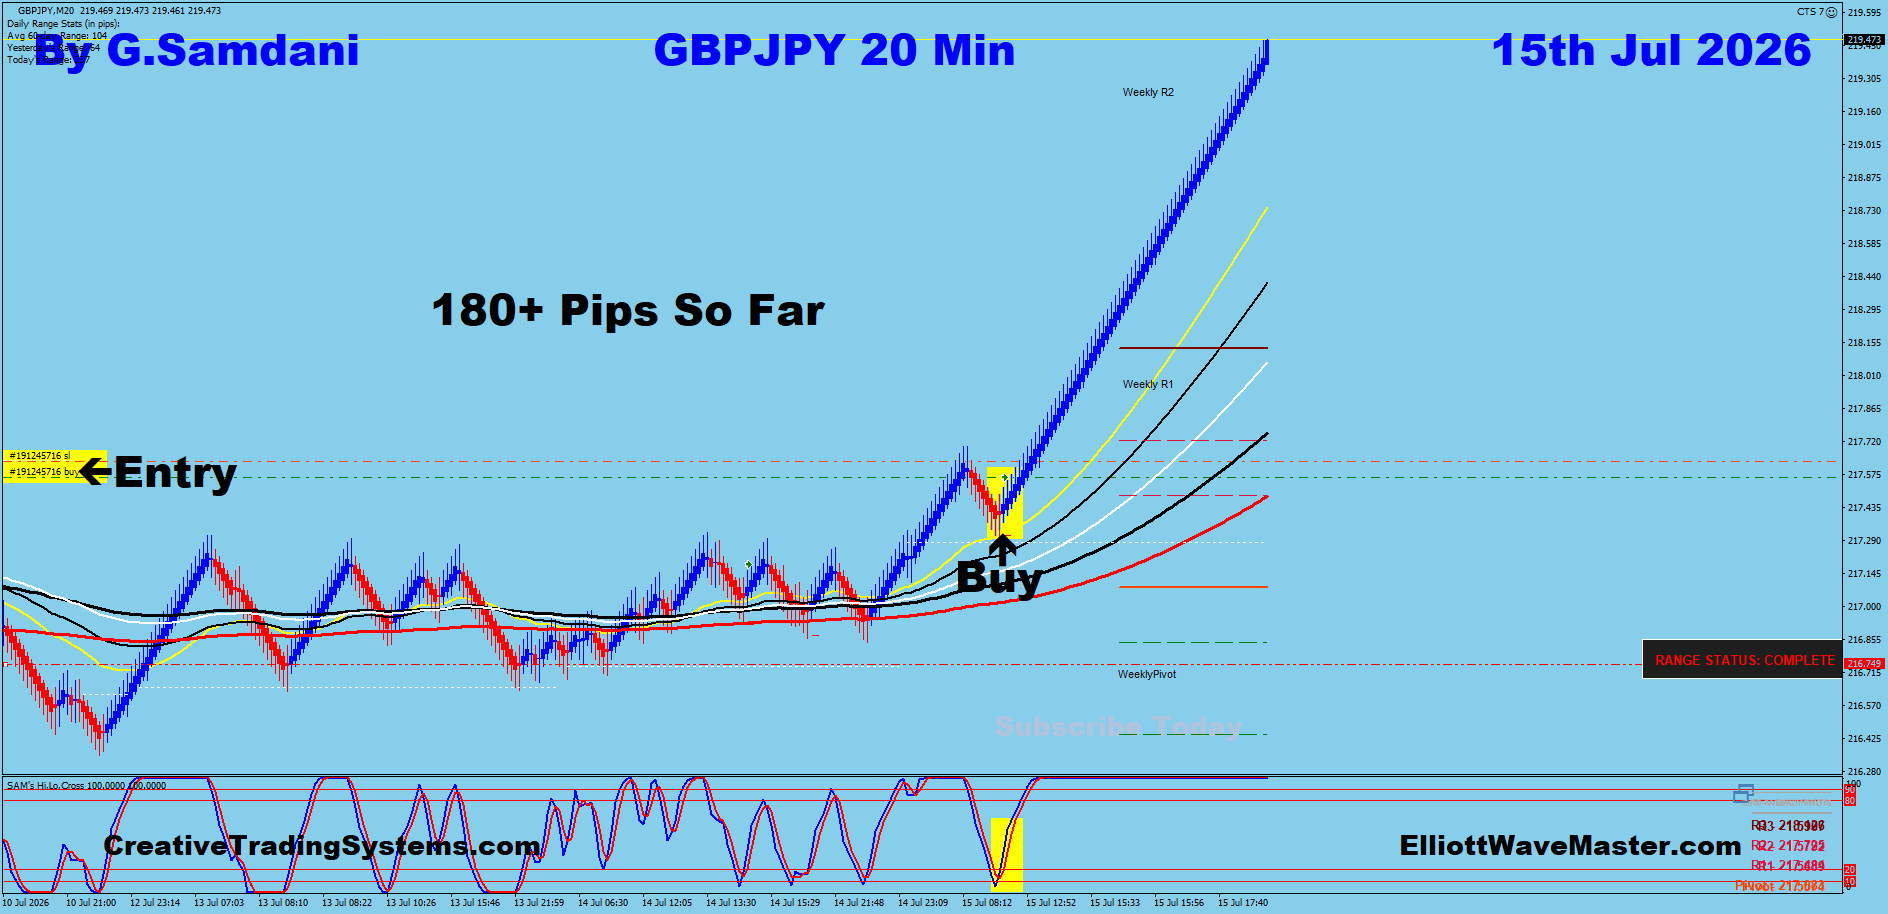
July 15 — Market outcome
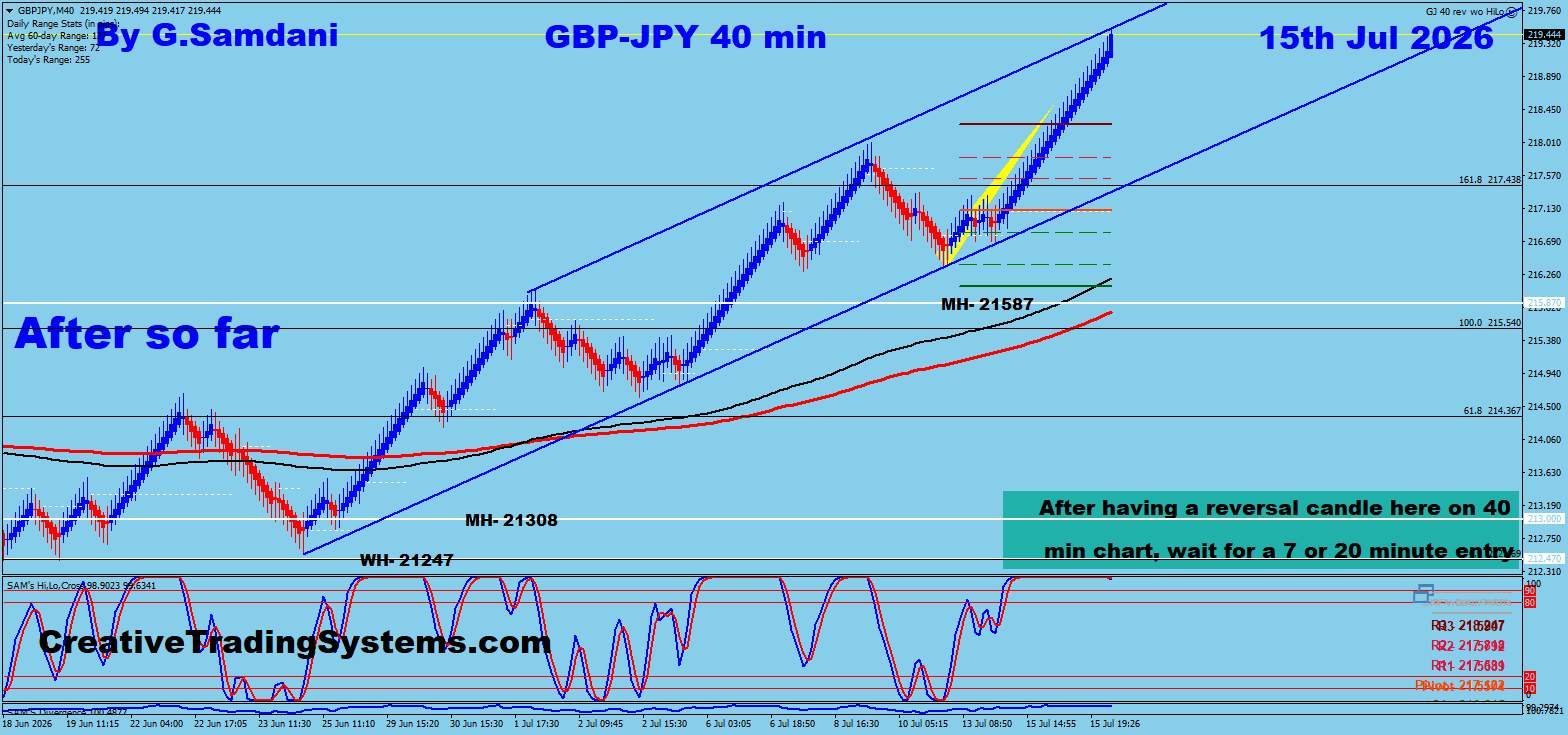
📈 Trade Taken
GBP/JPY — 20 Min Entry · July 15
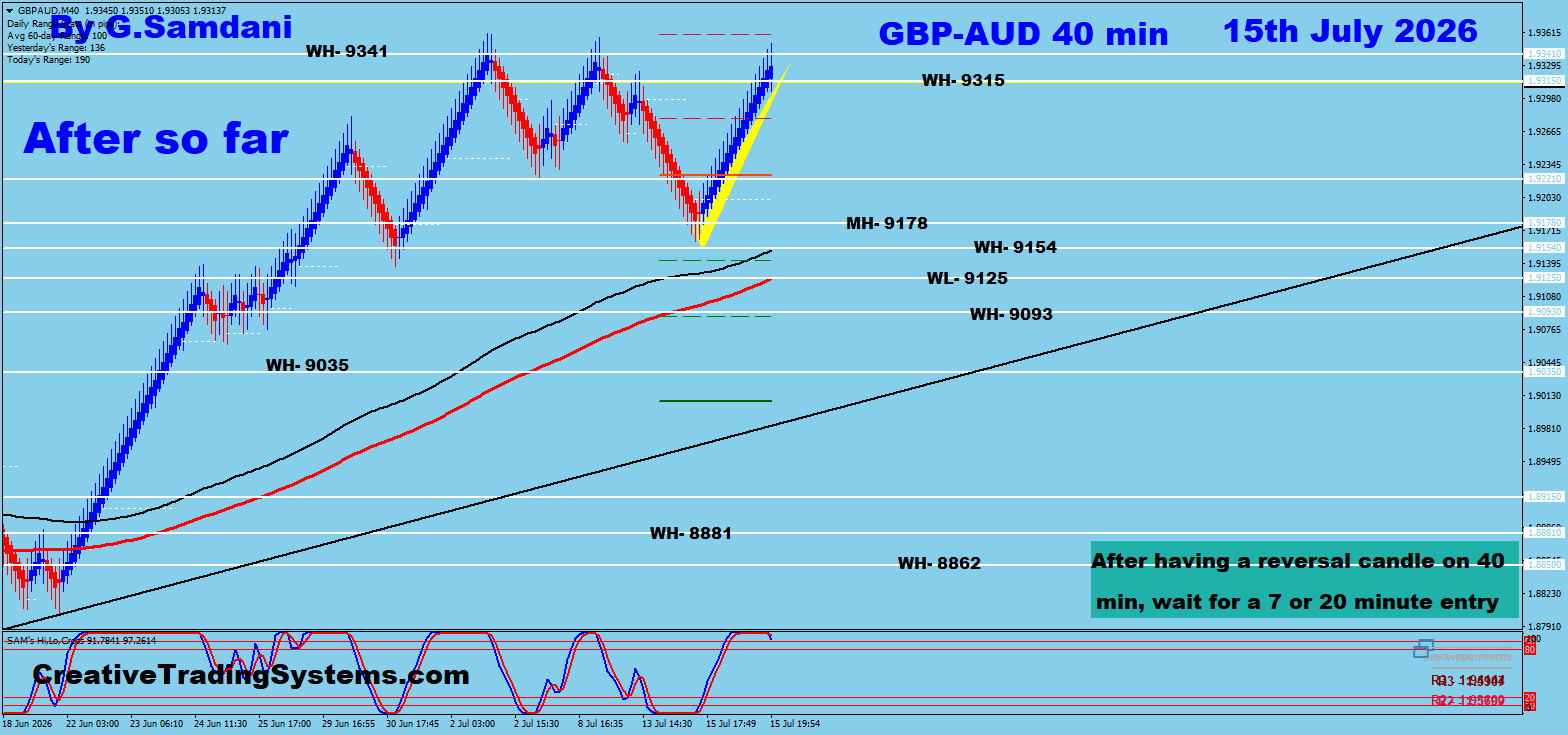
⏳ Developing
Before
July 14 — Marked-up analysis
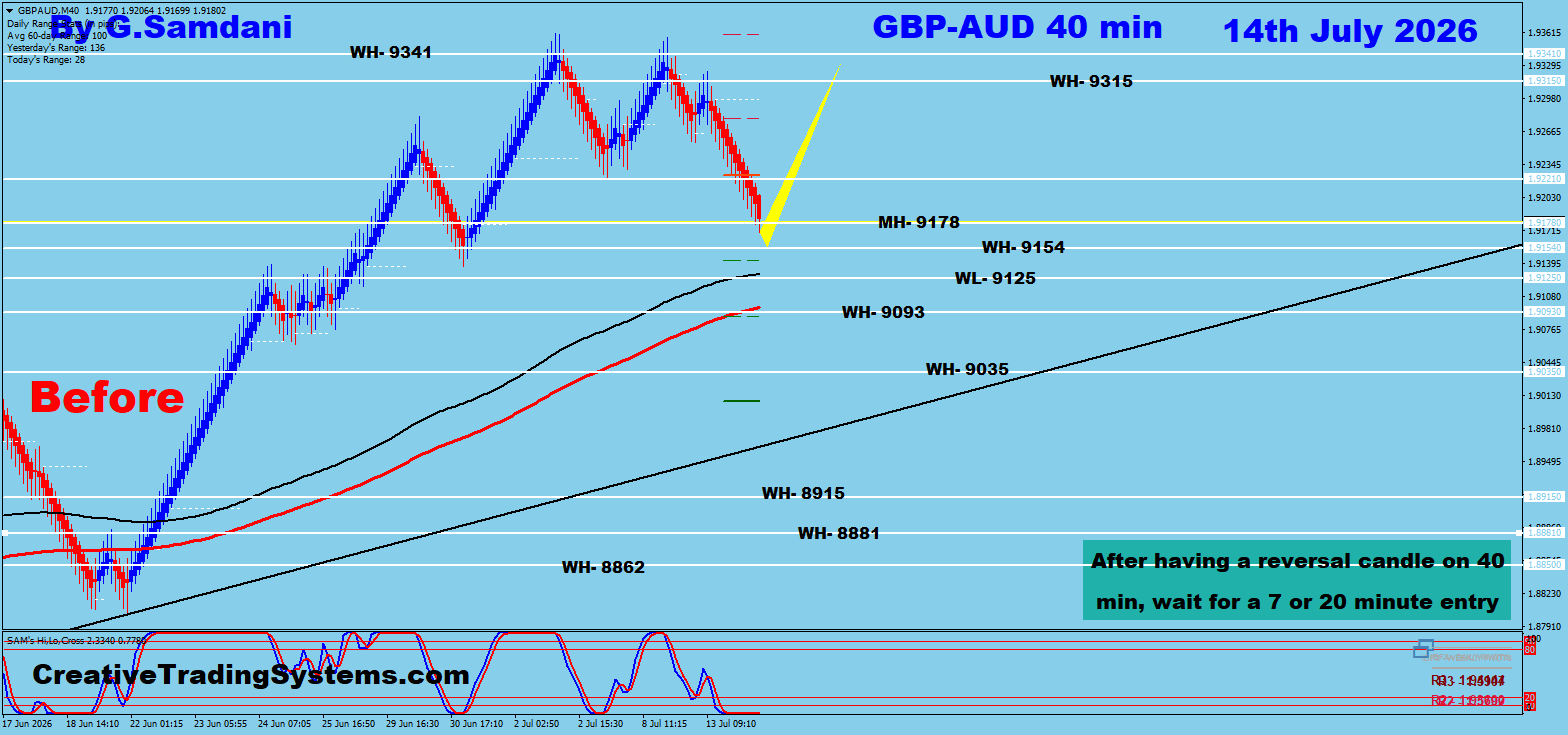
After
July 15 — After so far
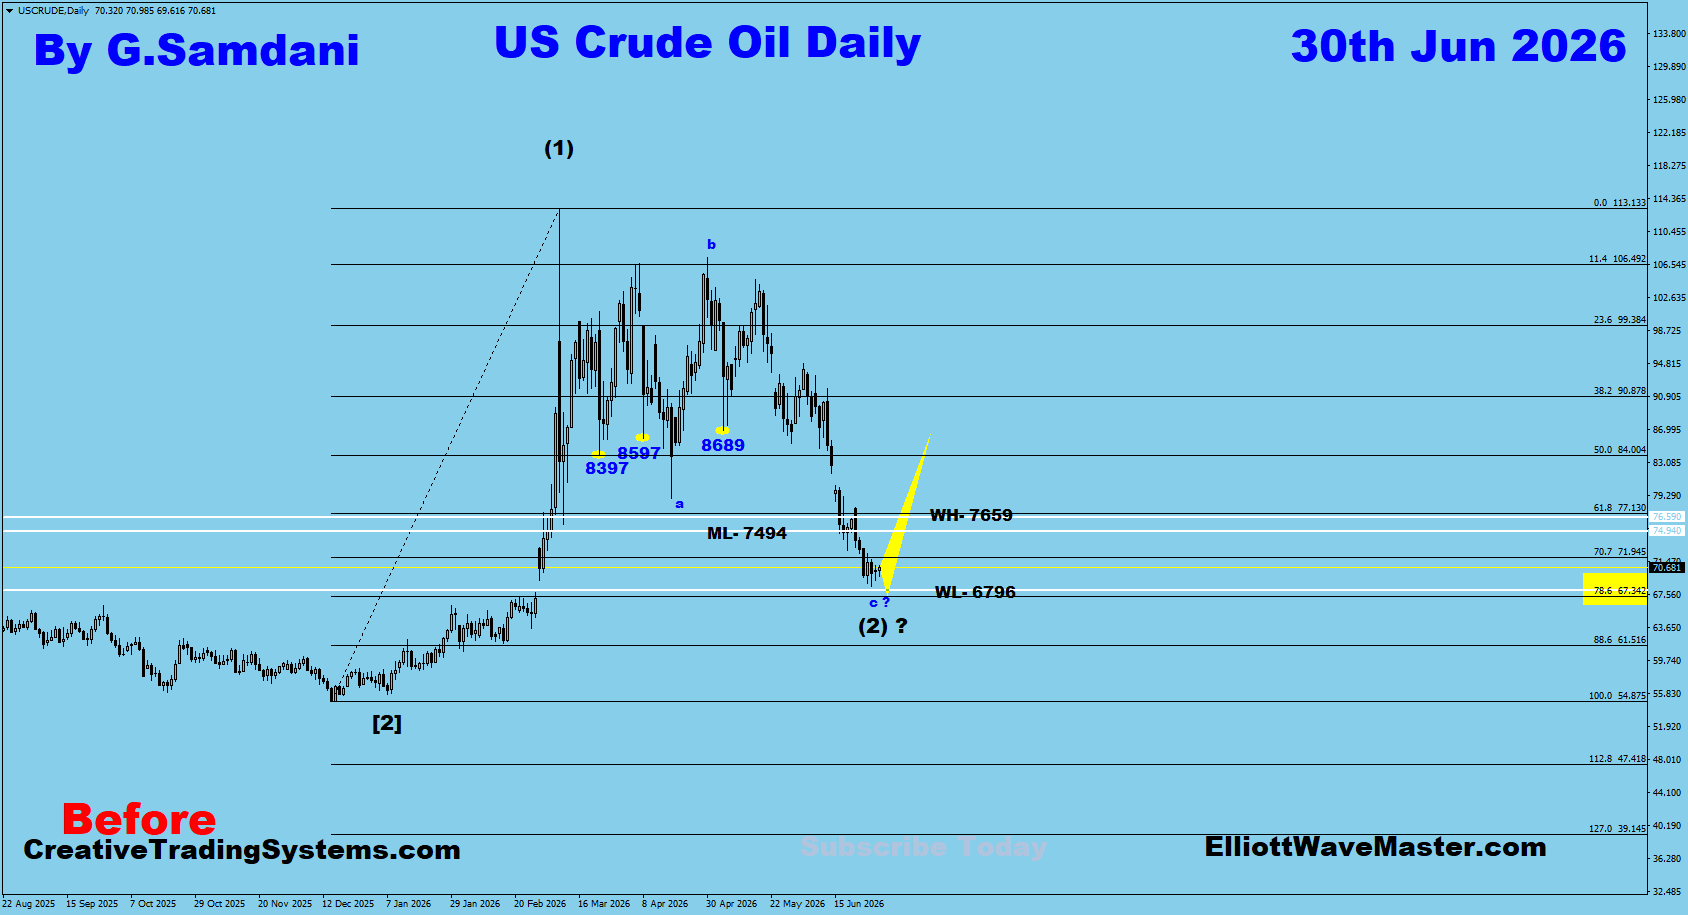
✅ Win
Before
June 30 — Marked-up analysis
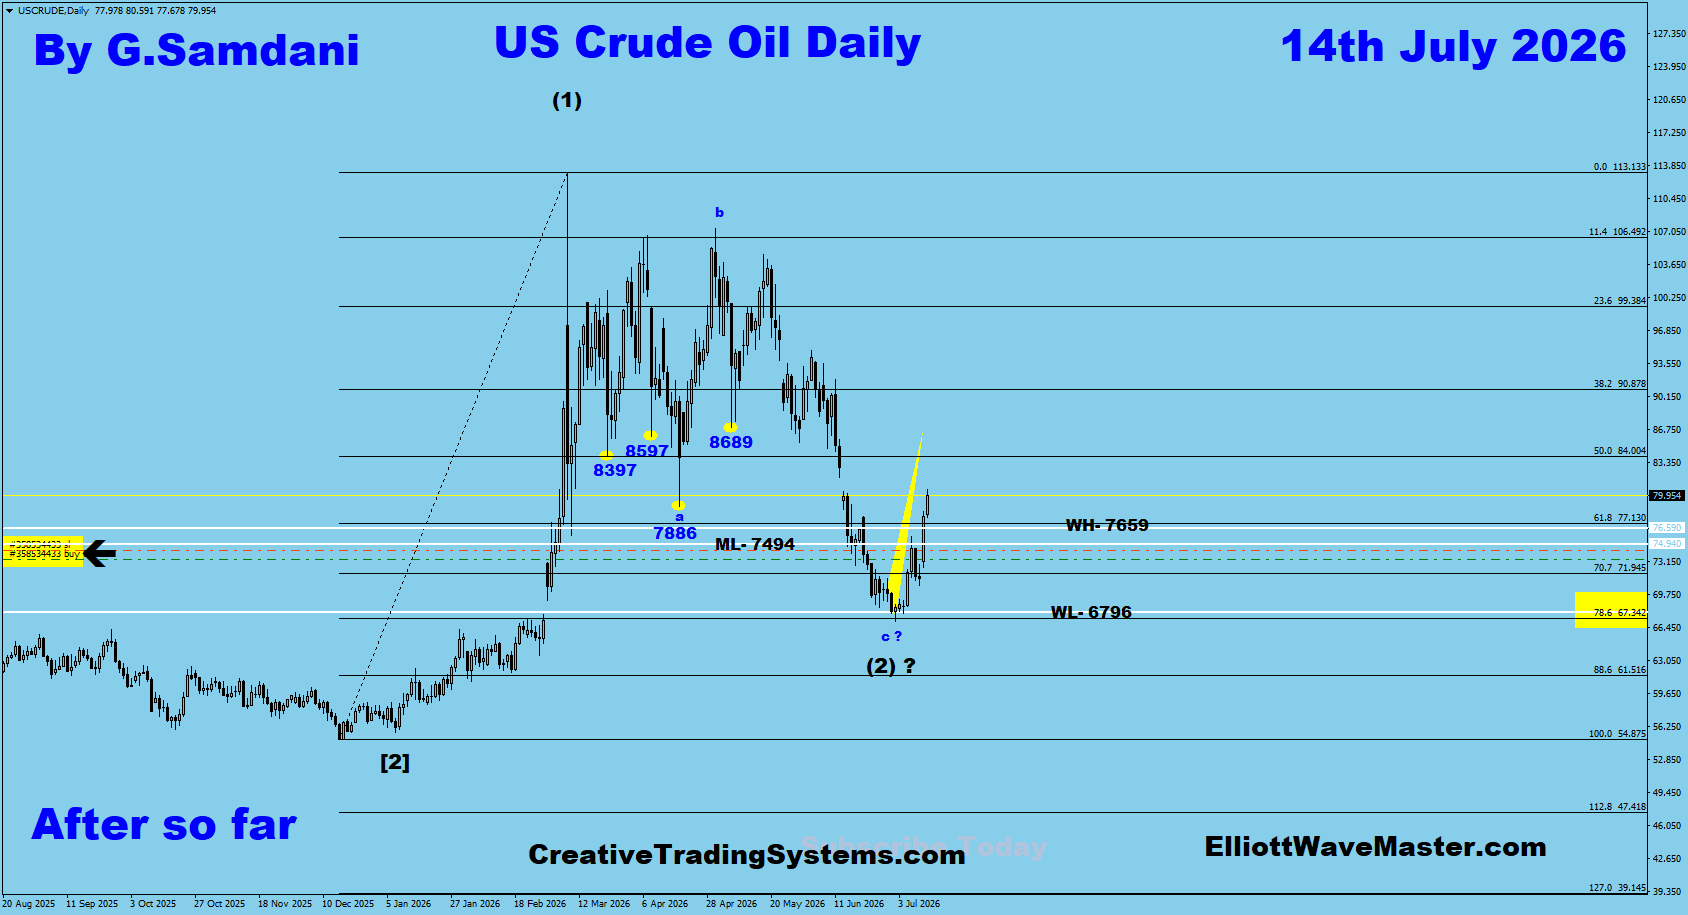
After
July 14 — Market outcome
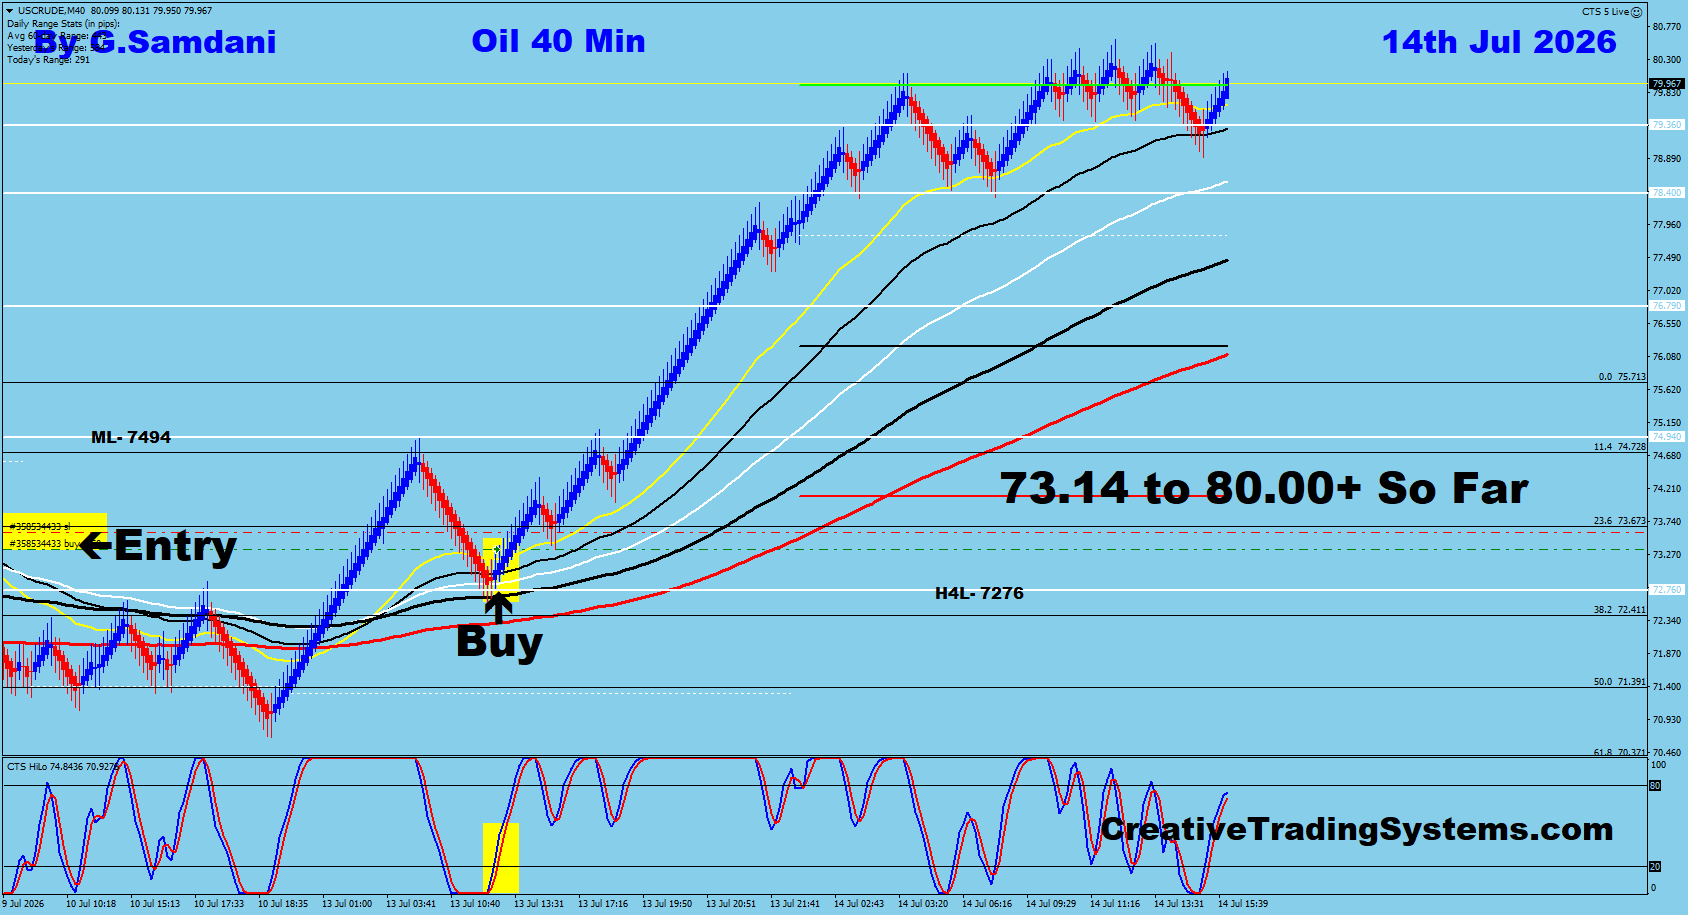
📈 Trade Taken
Oil — 40 Min Entry · July 14
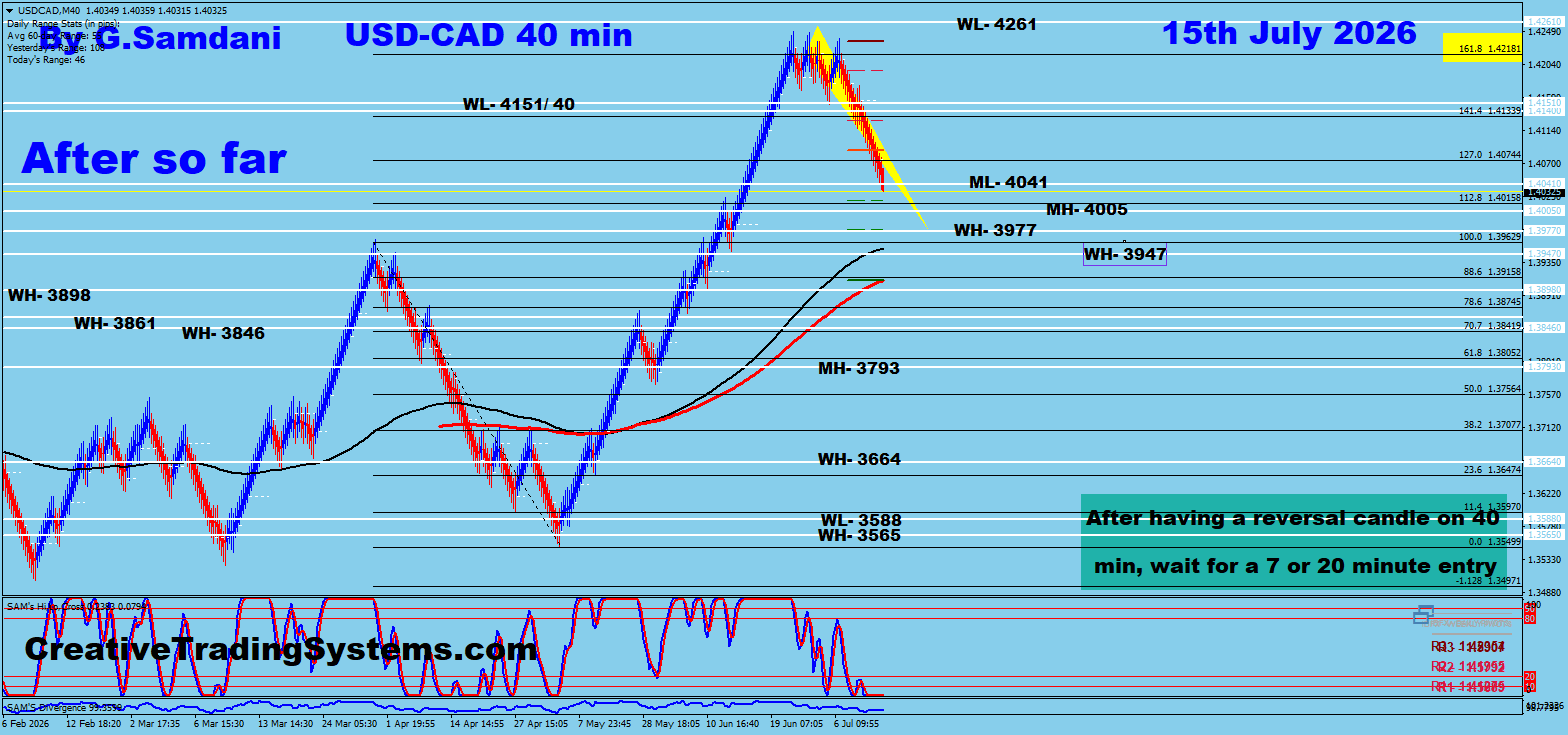
✅ Win
Before
June 30 — Marked-up analysis
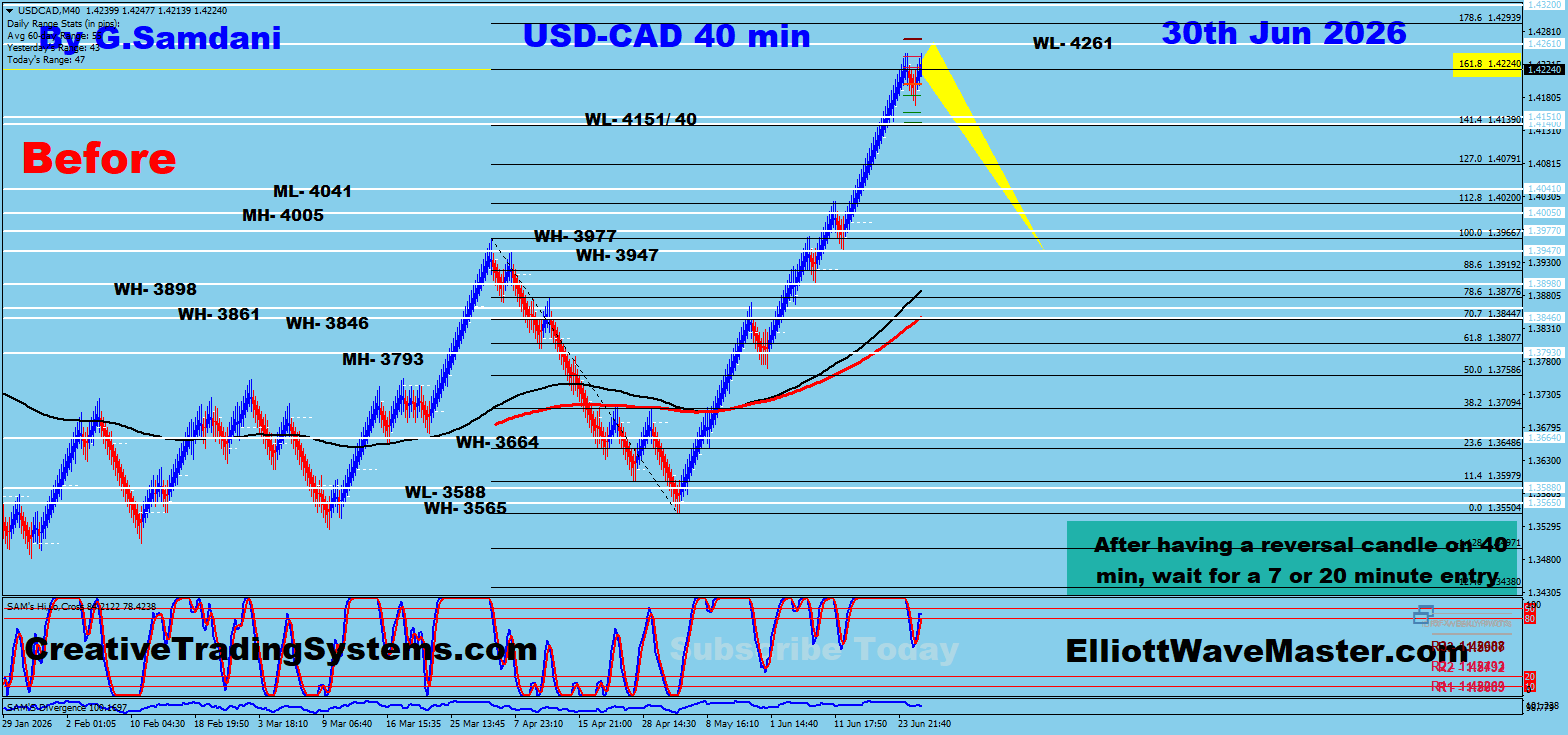
After
July 15 — Market outcome
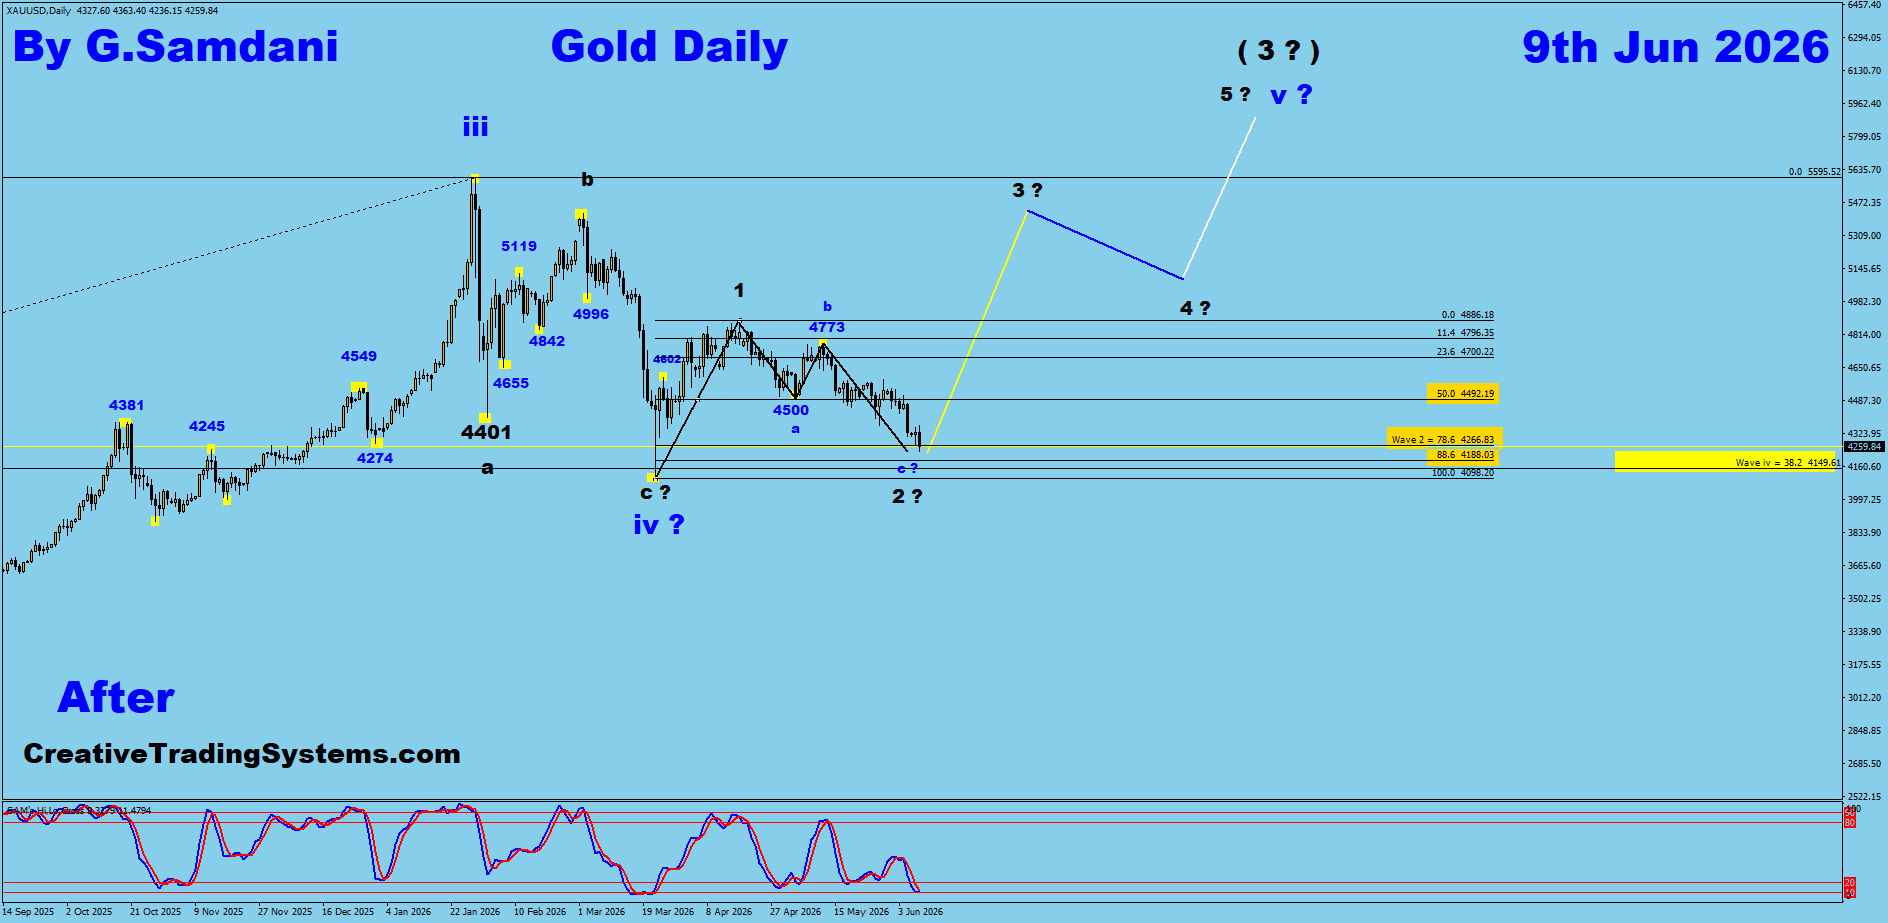
✅ Win
Before
April 14 — Marked-up analysis
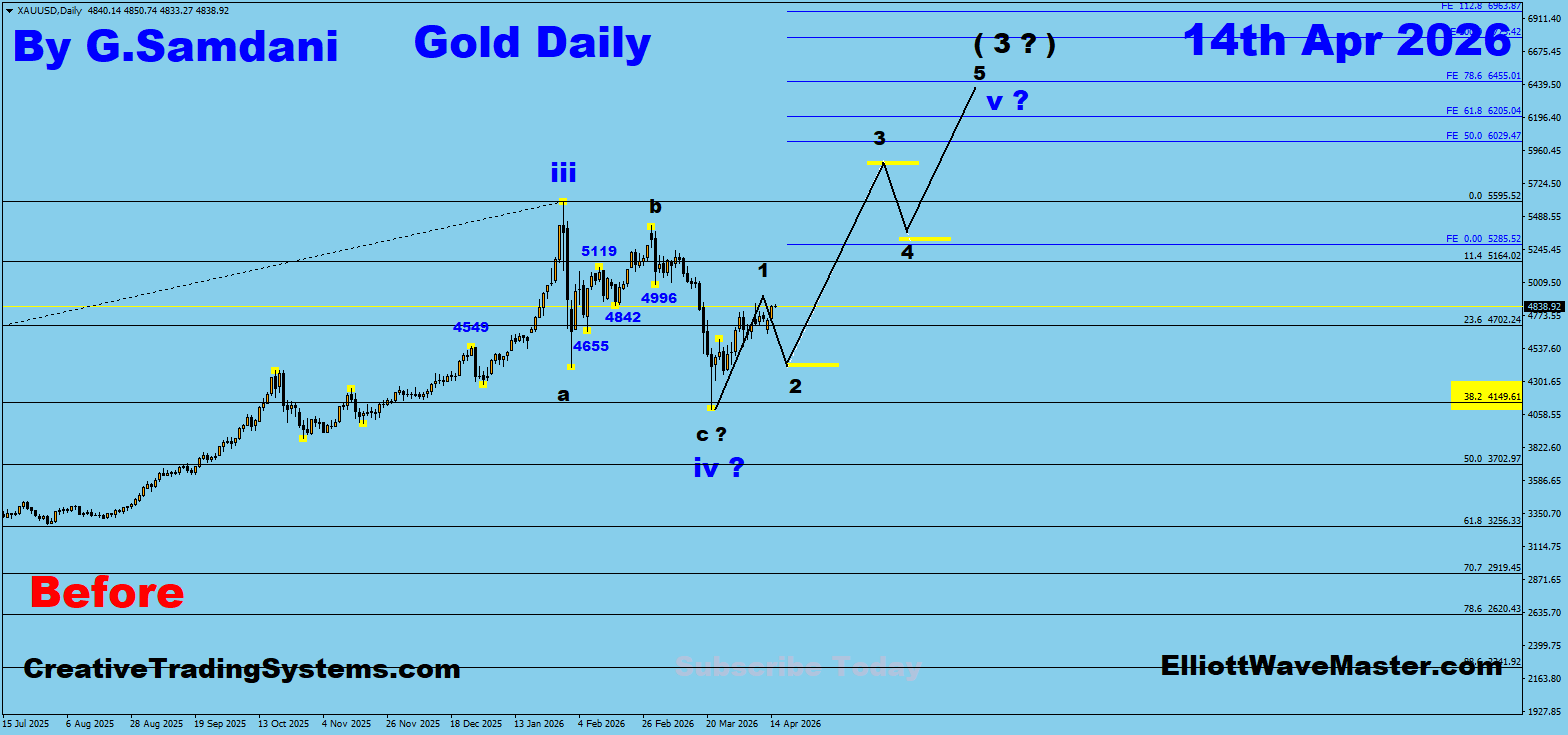
After
June 8 — Market outcome
✅ Win
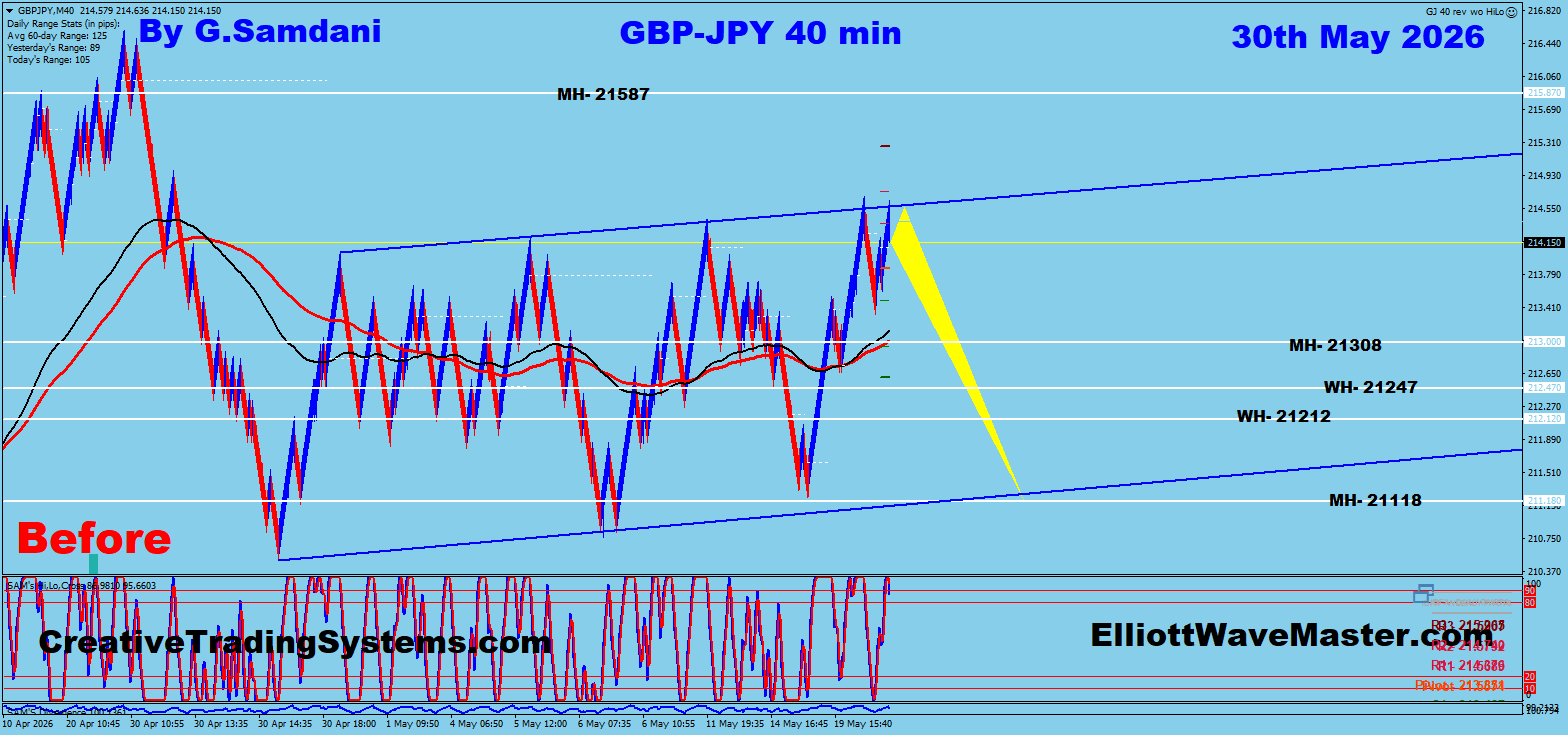
Before
May 30 — Marked-up analysis
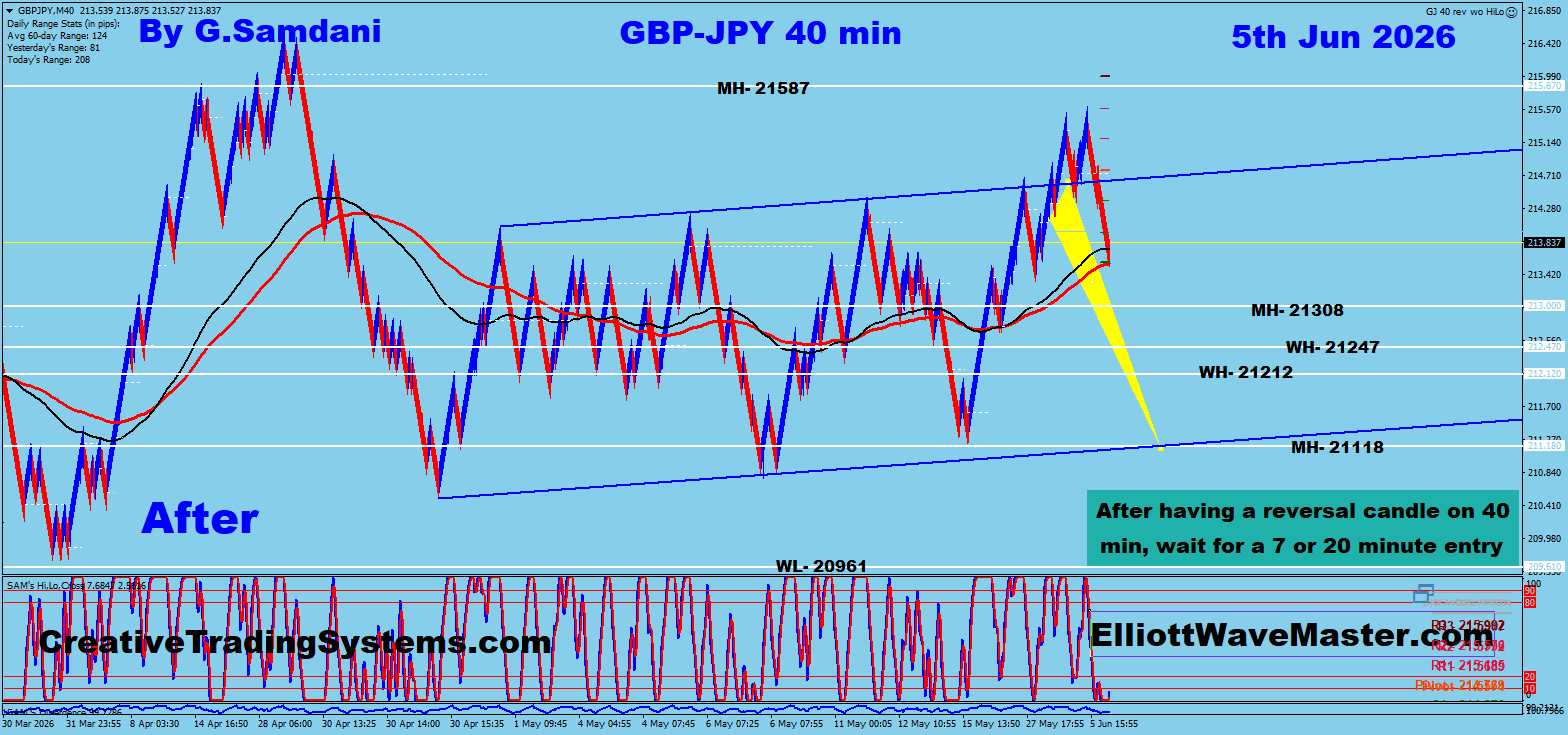
After
June 5 — Market outcome
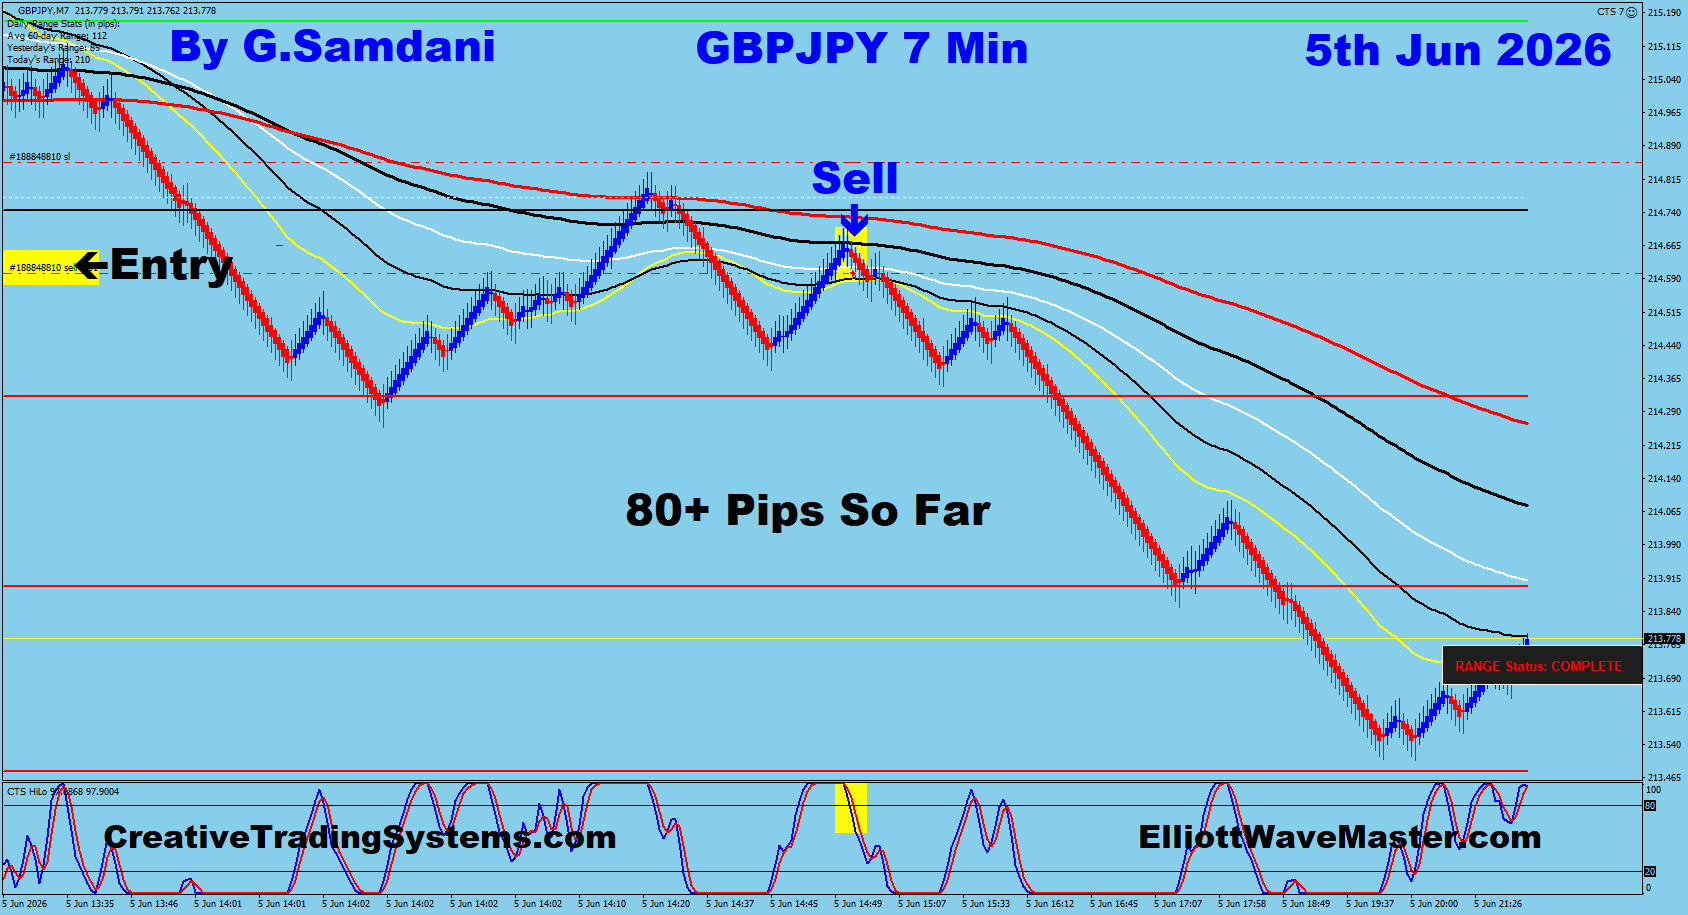
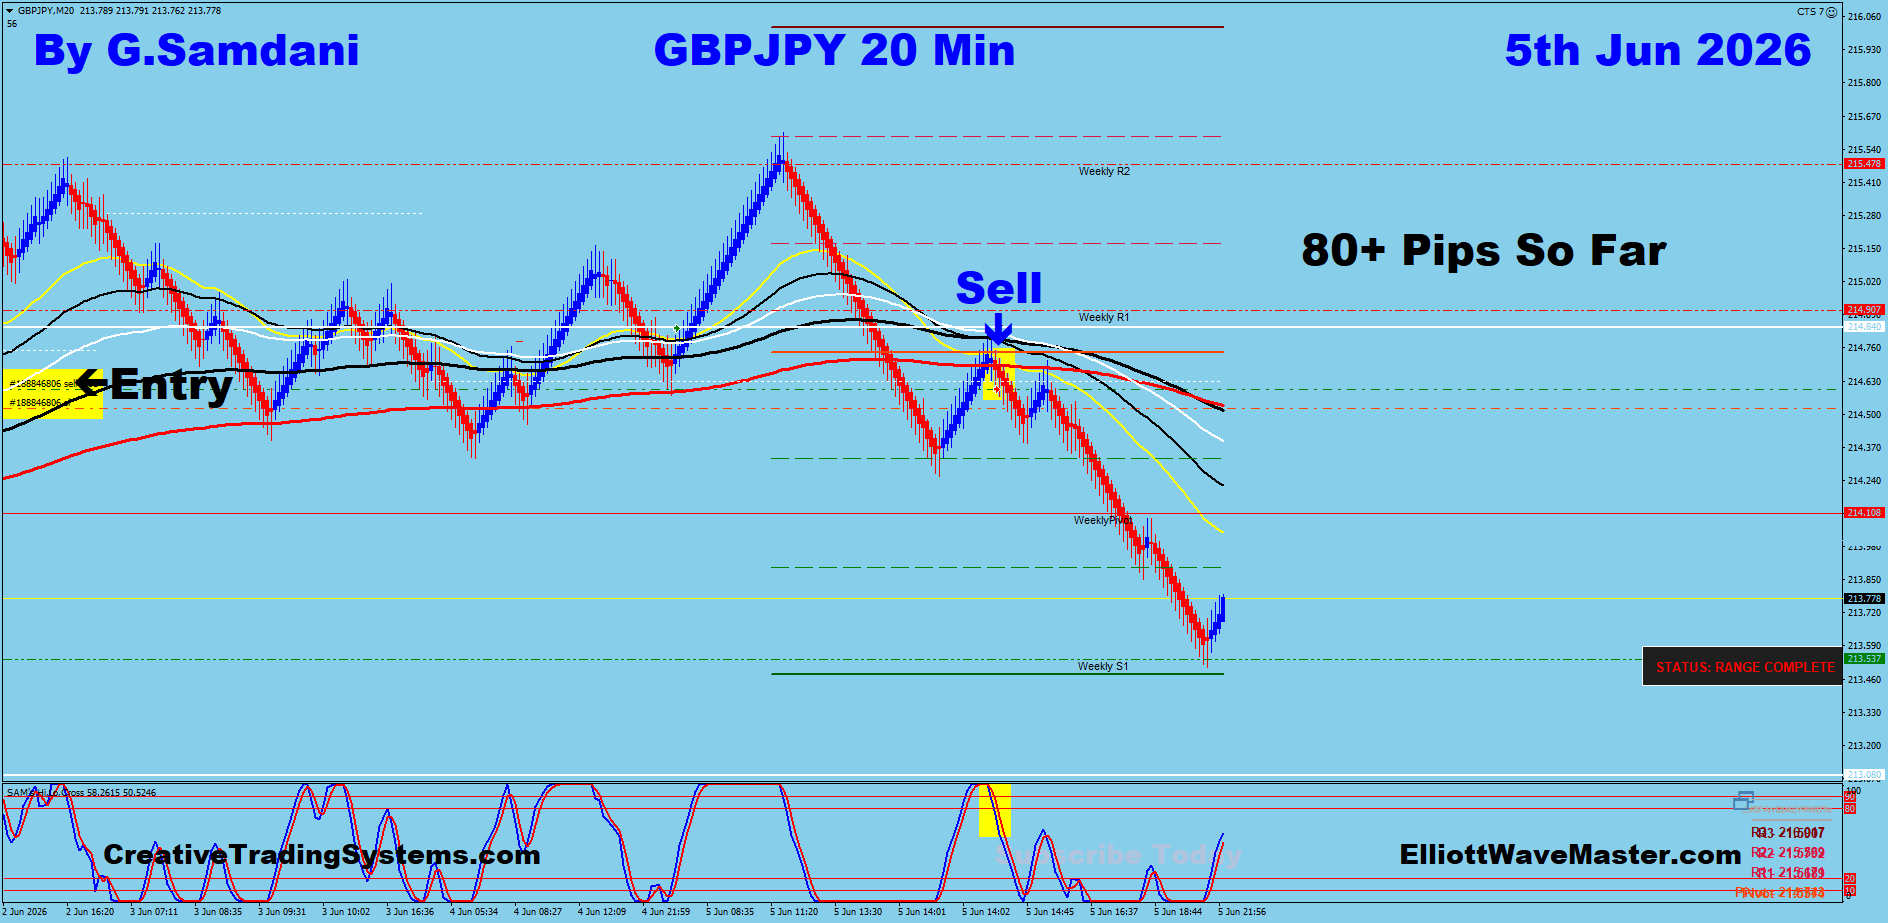
📈 Trades Taken
GBP/JPY — 7 Min & 20 Min Entries · June 5
✅ Win
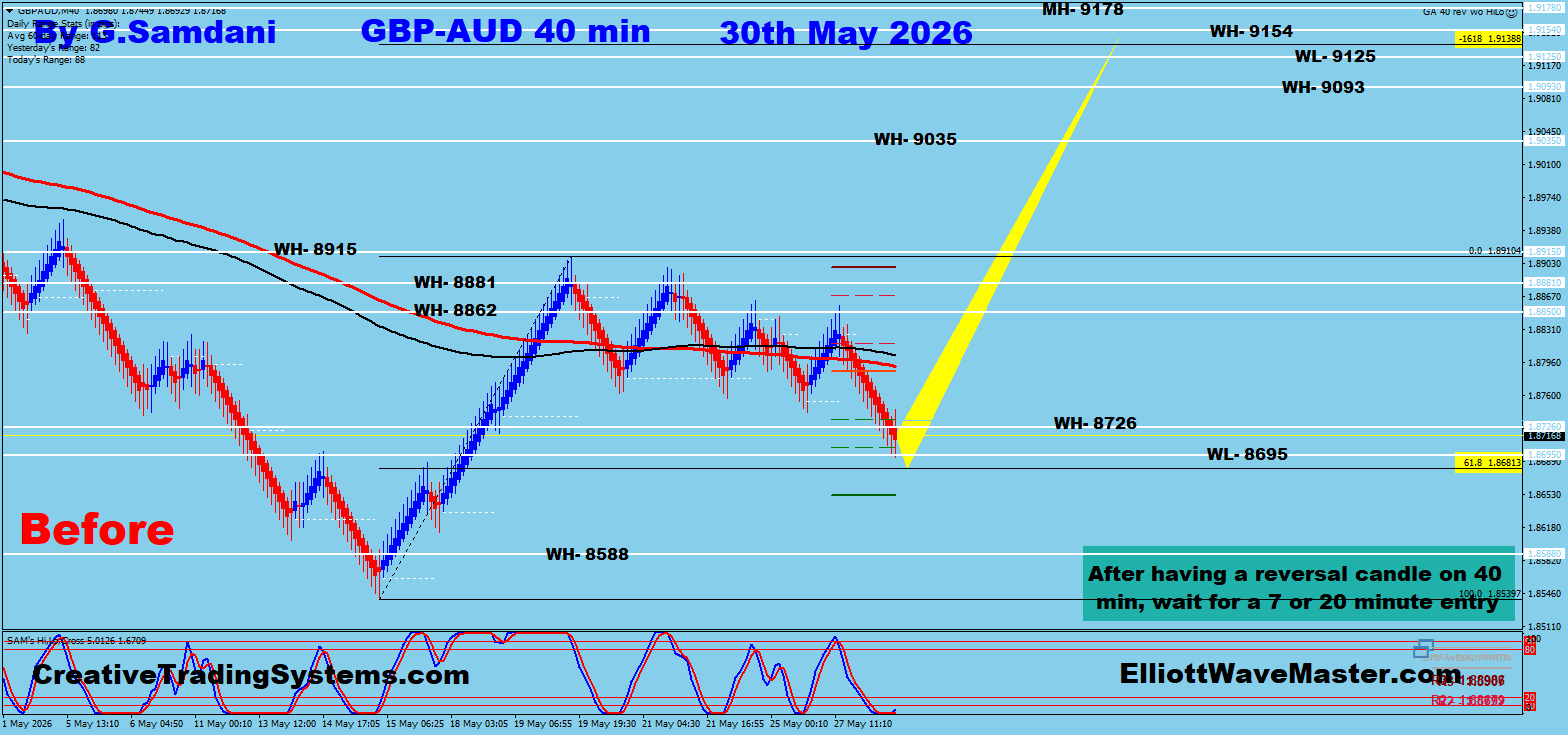
Before
May 30 — Marked-up analysis
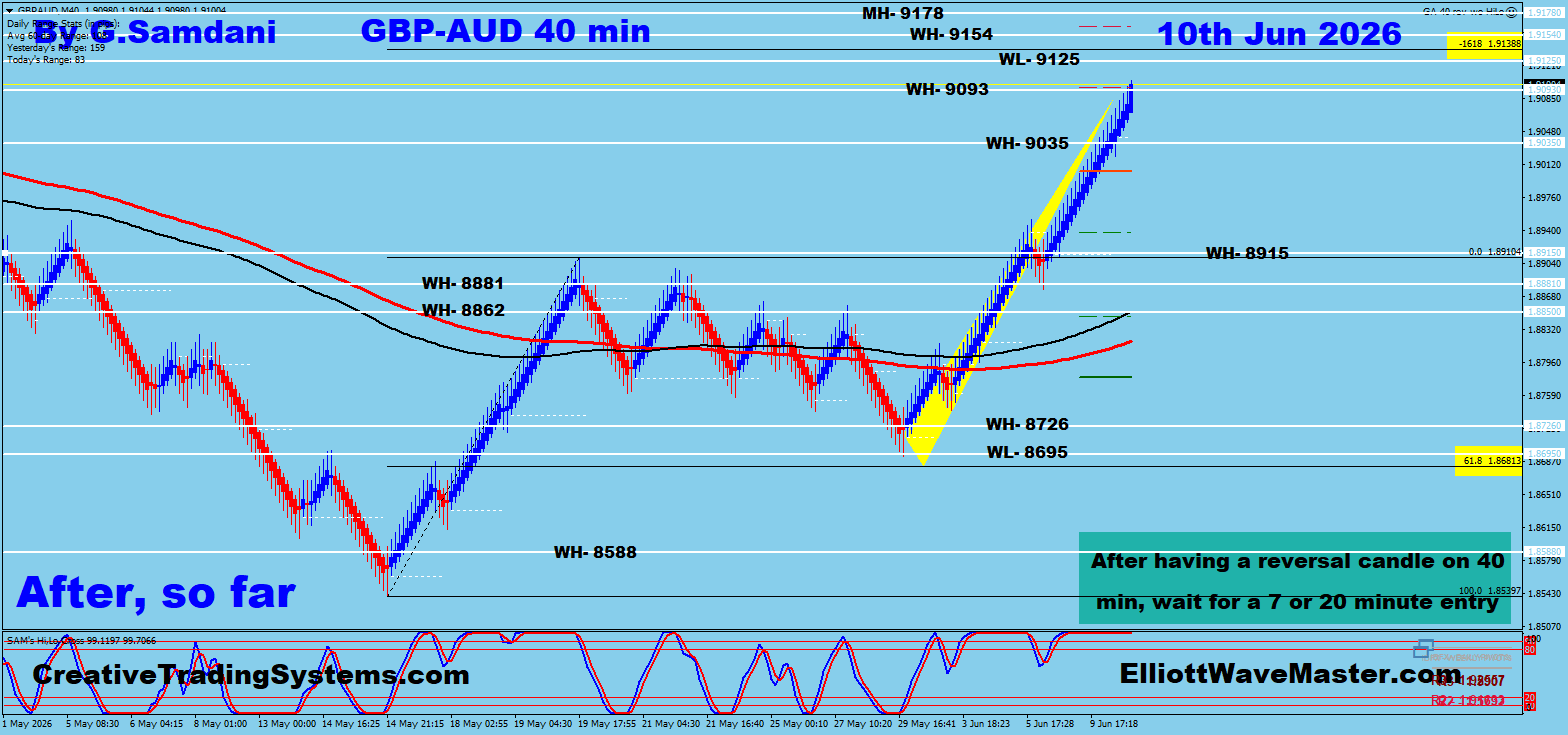
After
June 10 — Market outcome
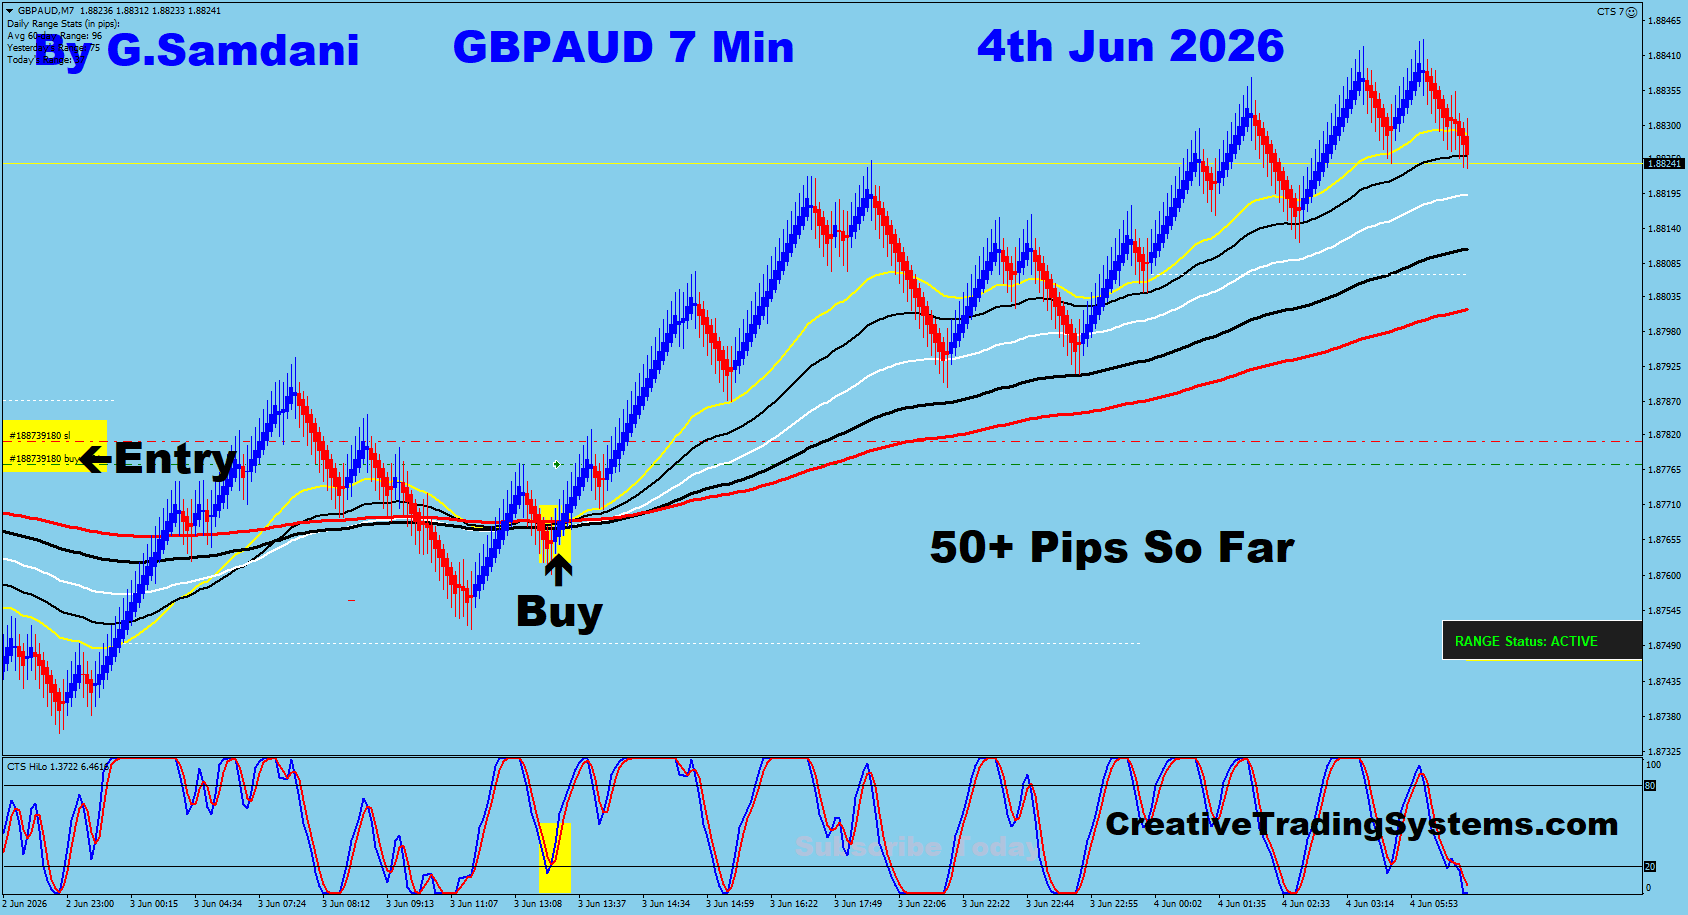
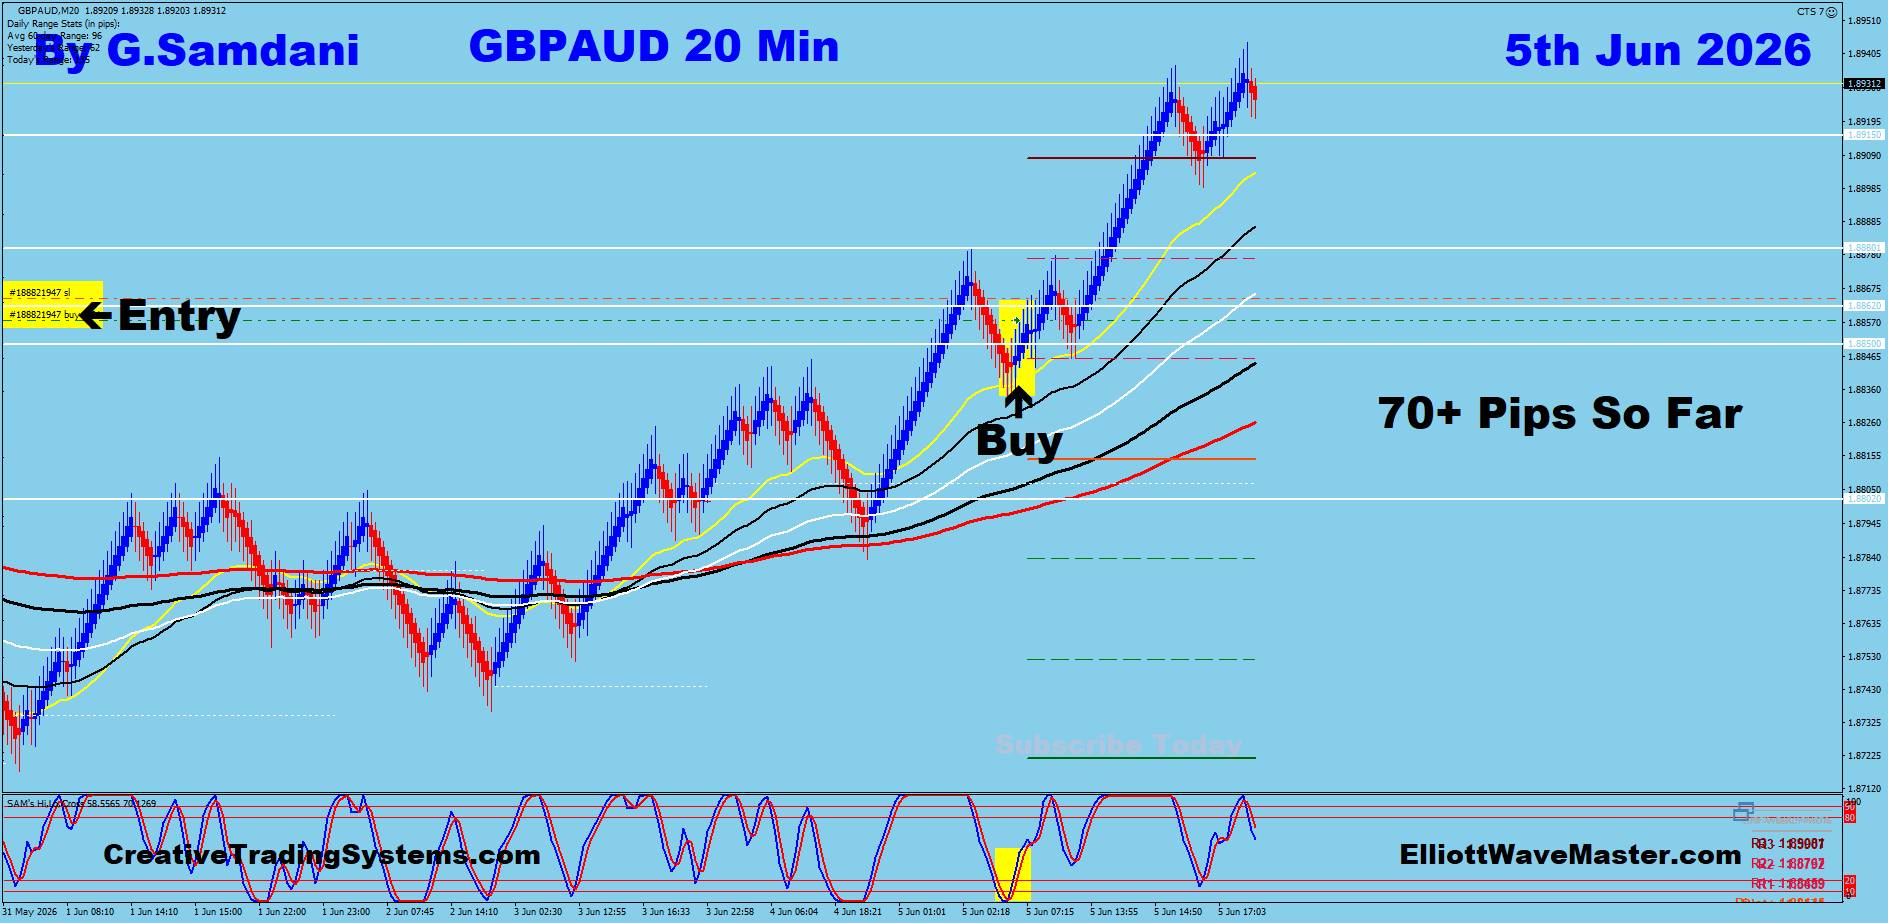
📈 Trades Taken
GBP/AUD — June 4 & June 5 Entries
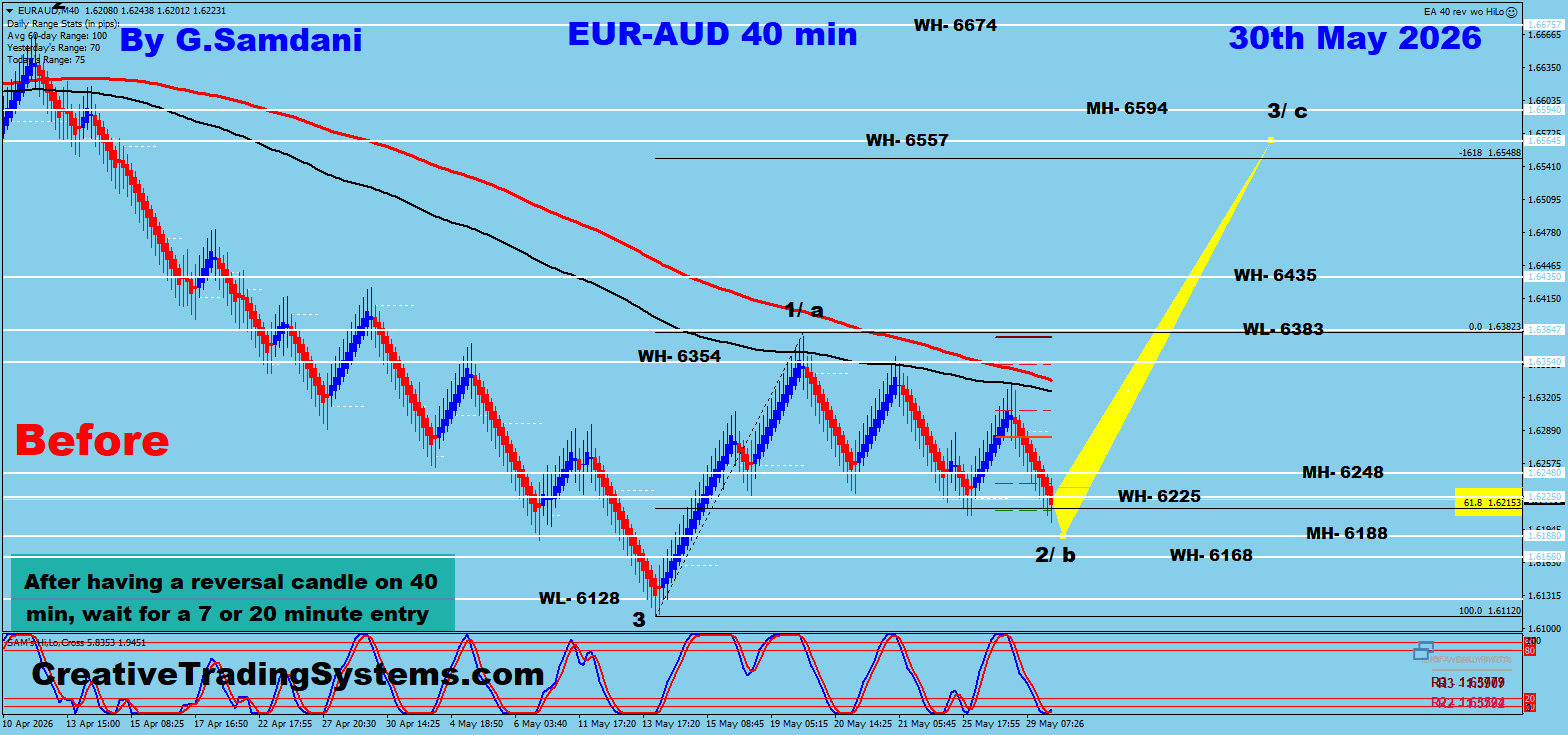
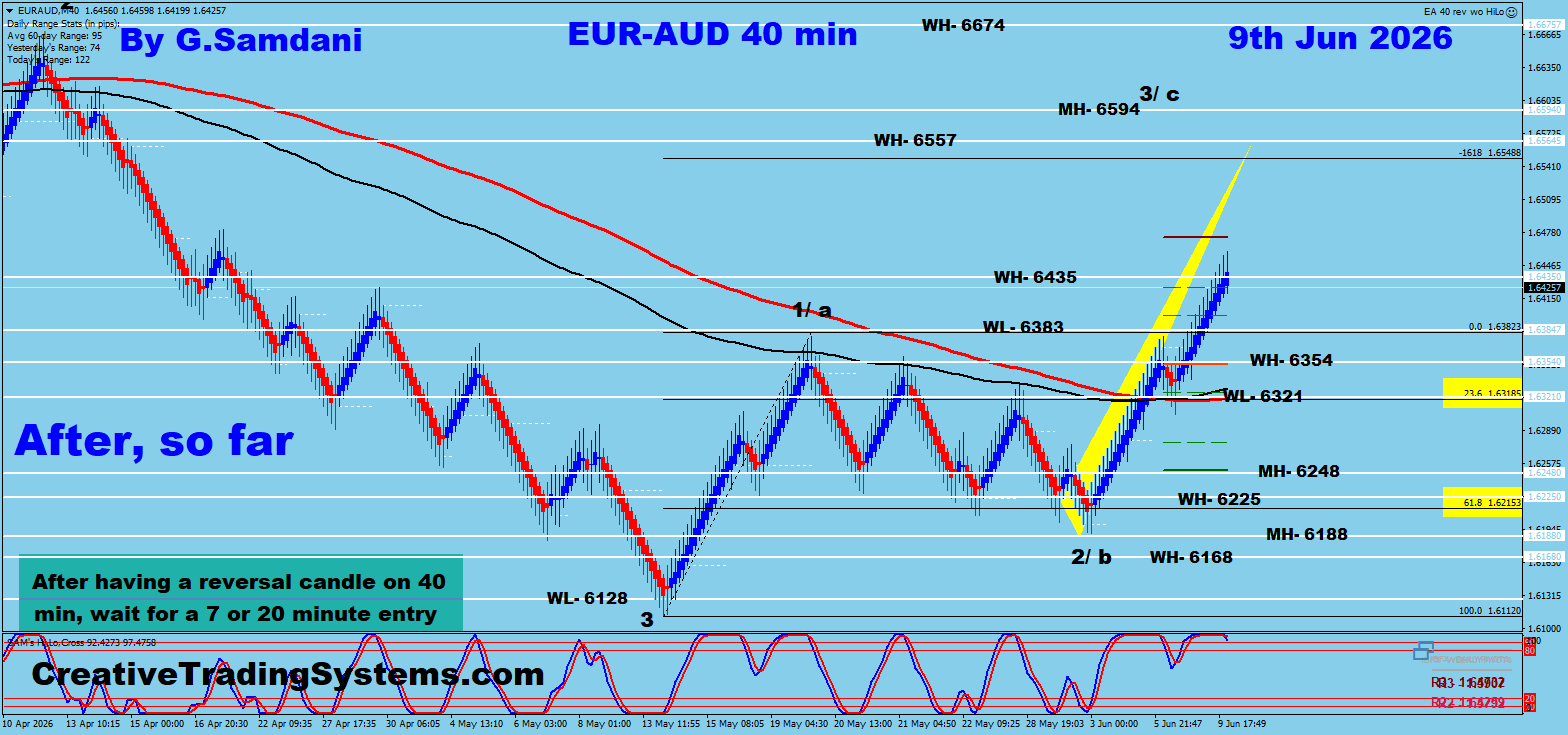
✅ Win
Before
May 30 — Marked-up analysis
After
June 9 — Market outcome
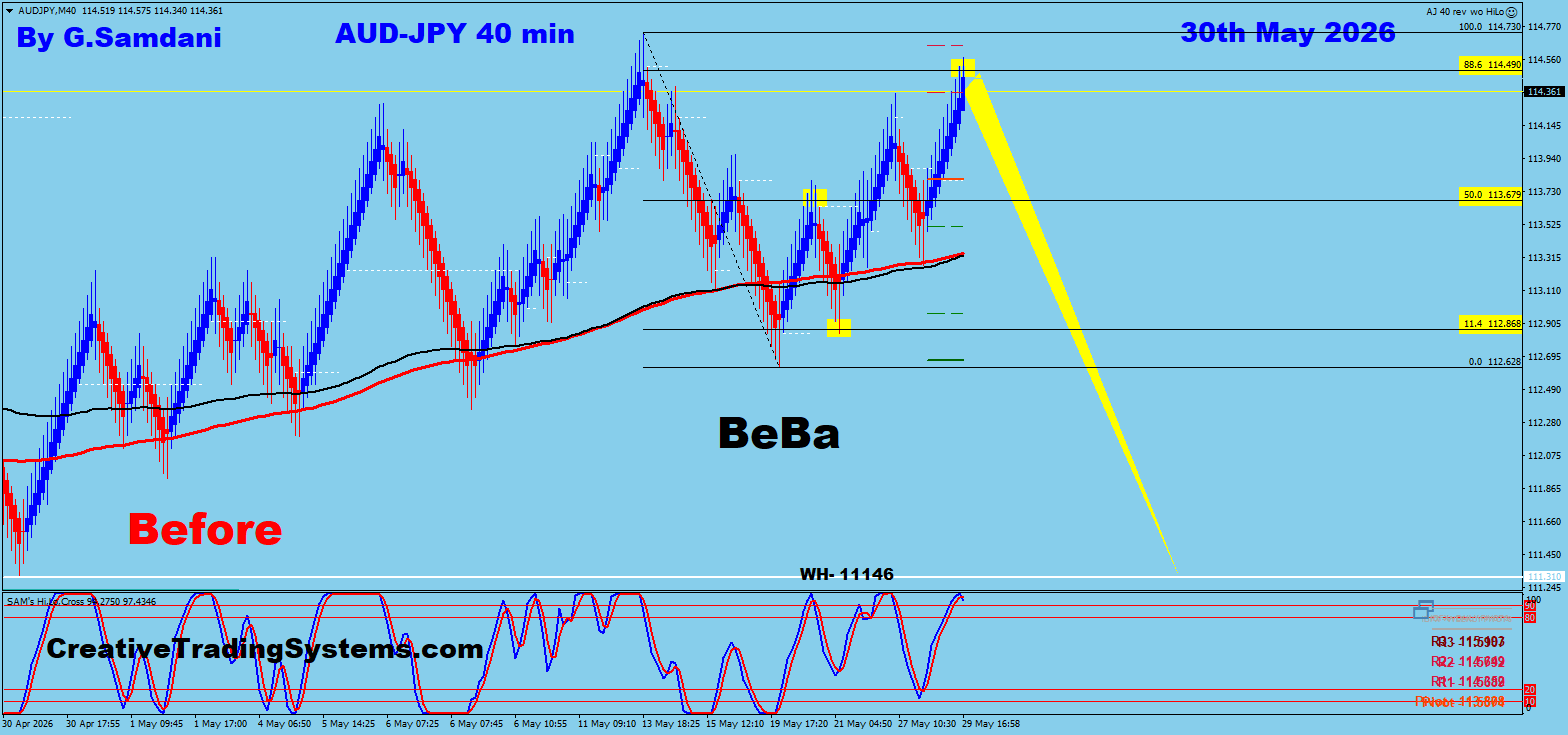
✅ Win
Before
May 30 — Marked-up analysis
After
June 5 — Market outcome
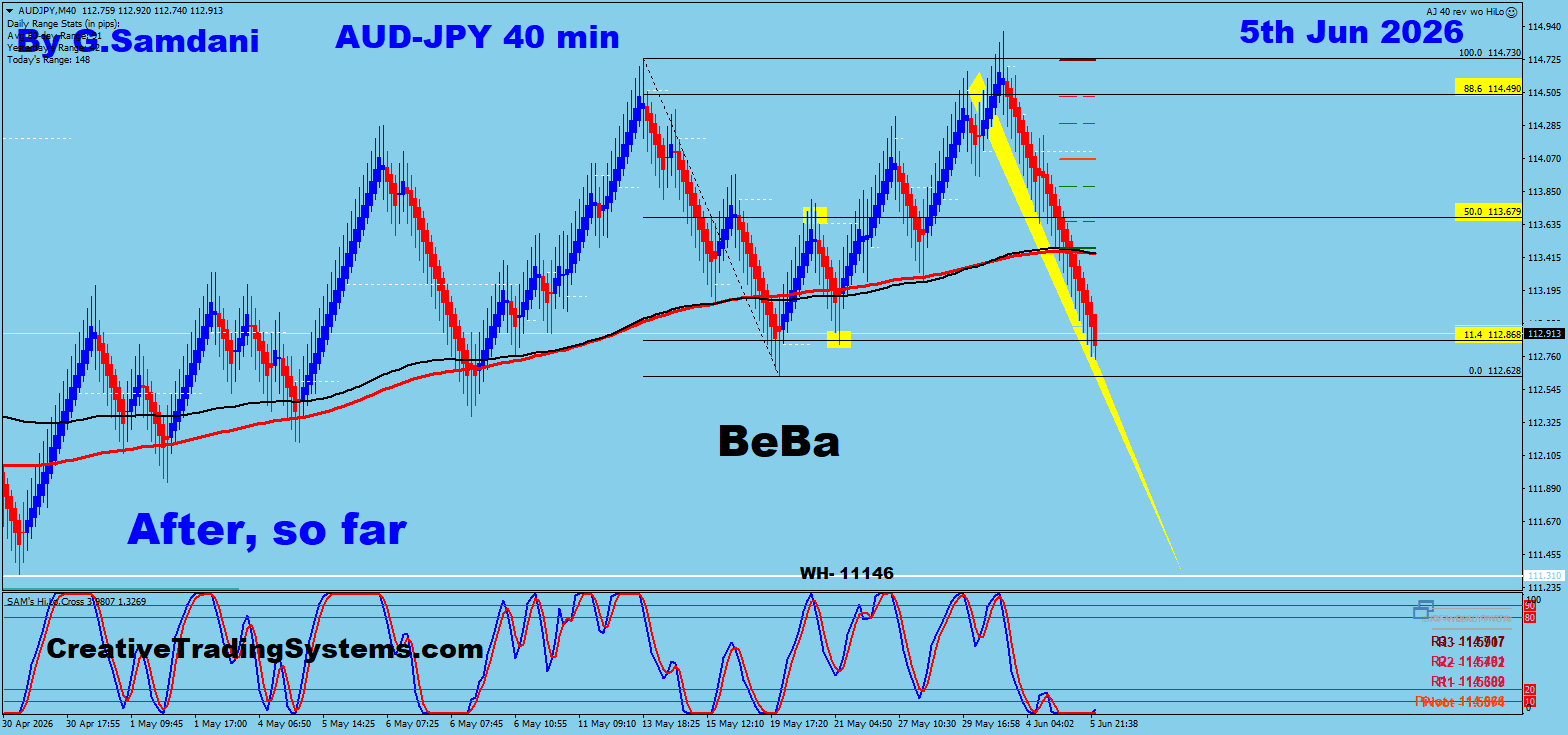
📈 Trade Taken
AUD/JPY — 20 Min Entry · June 5
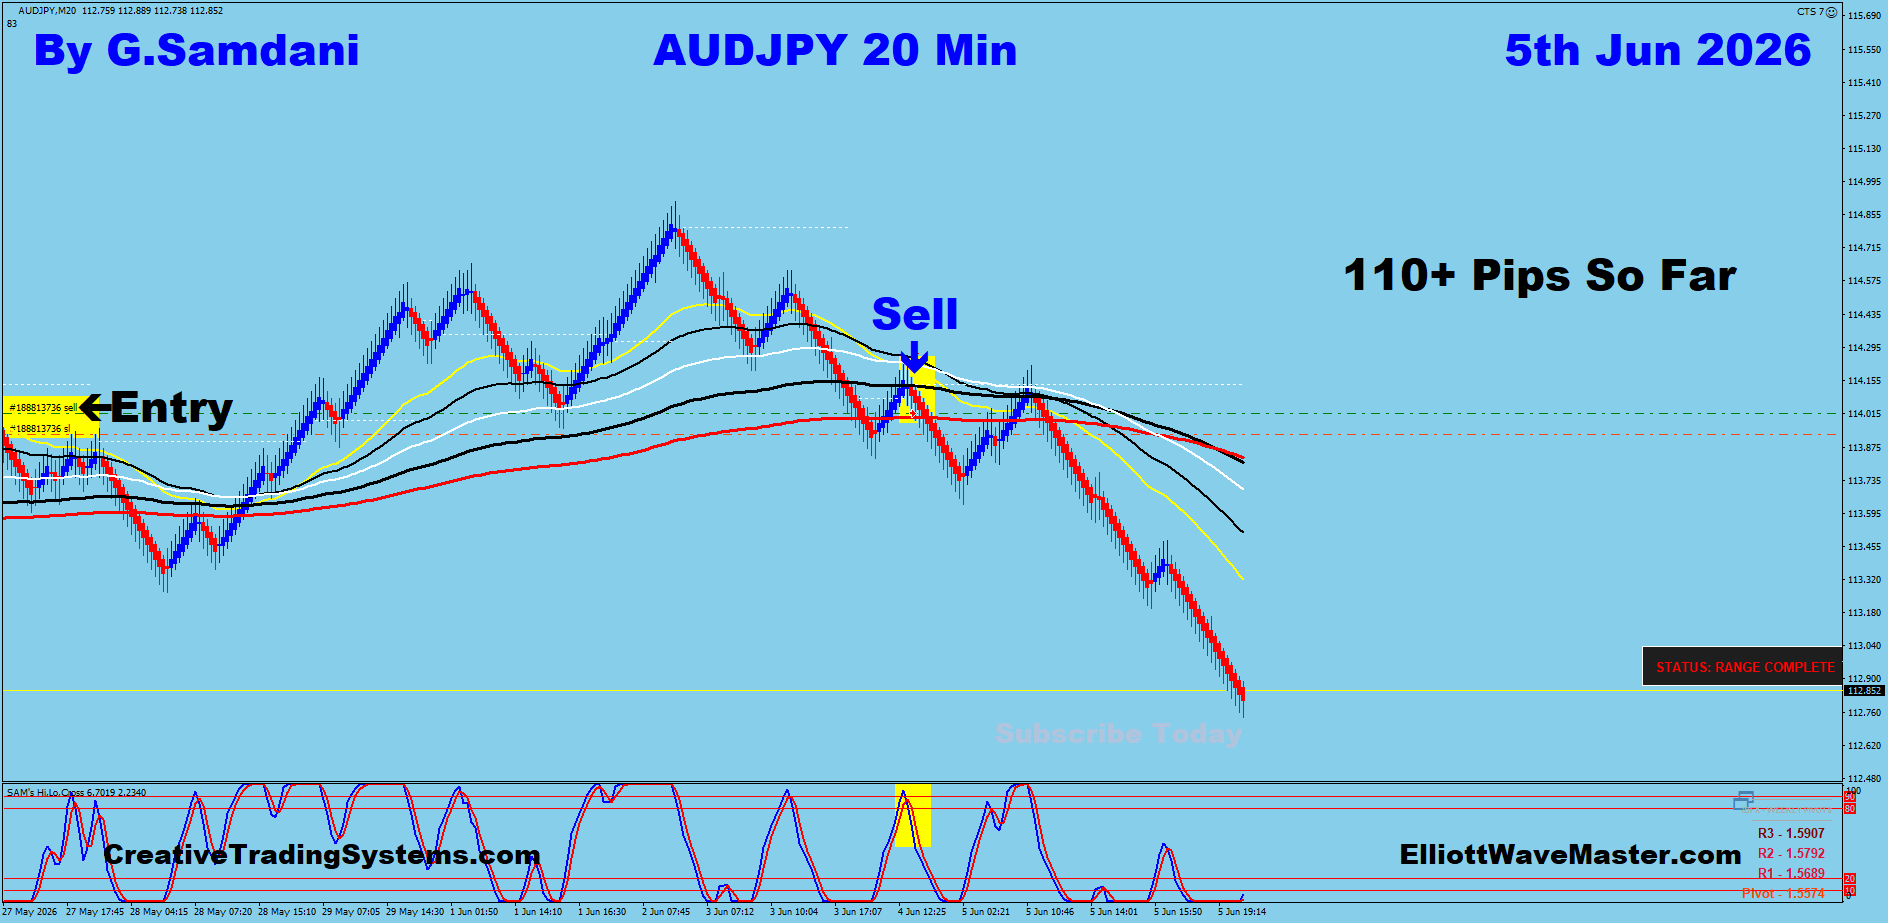
✅ Win
Before
May 30 — Marked-up analysis
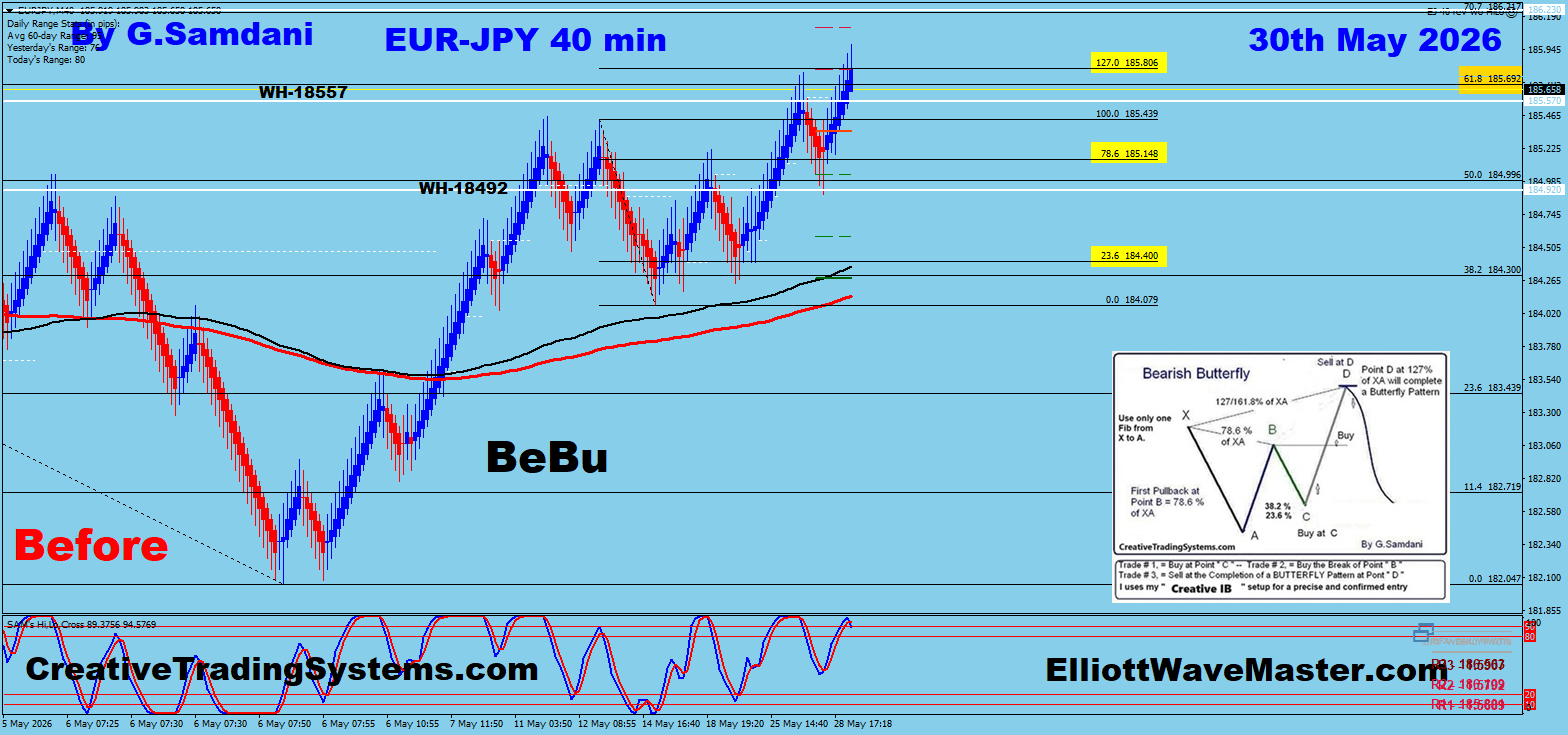
After
June 5 — Market outcome
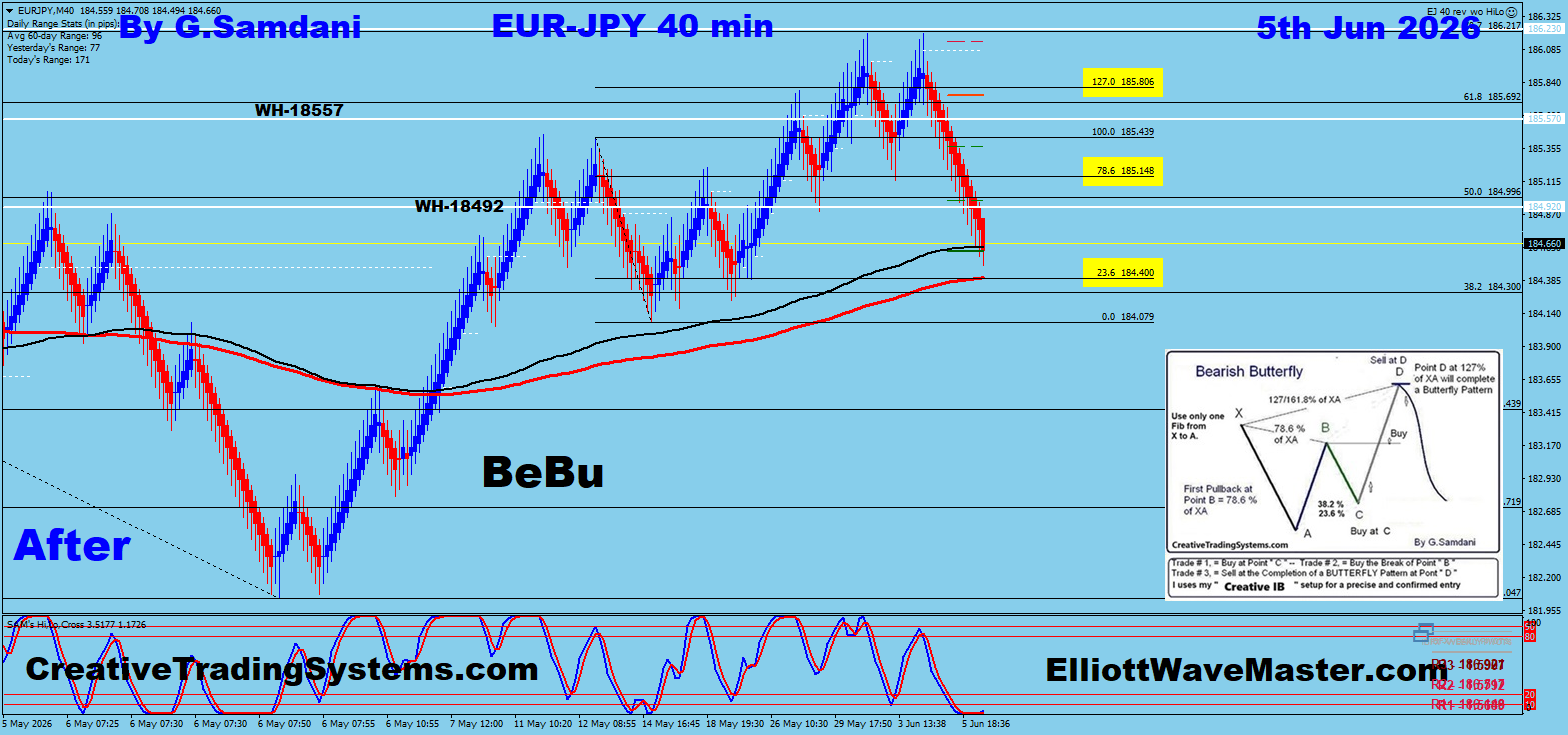
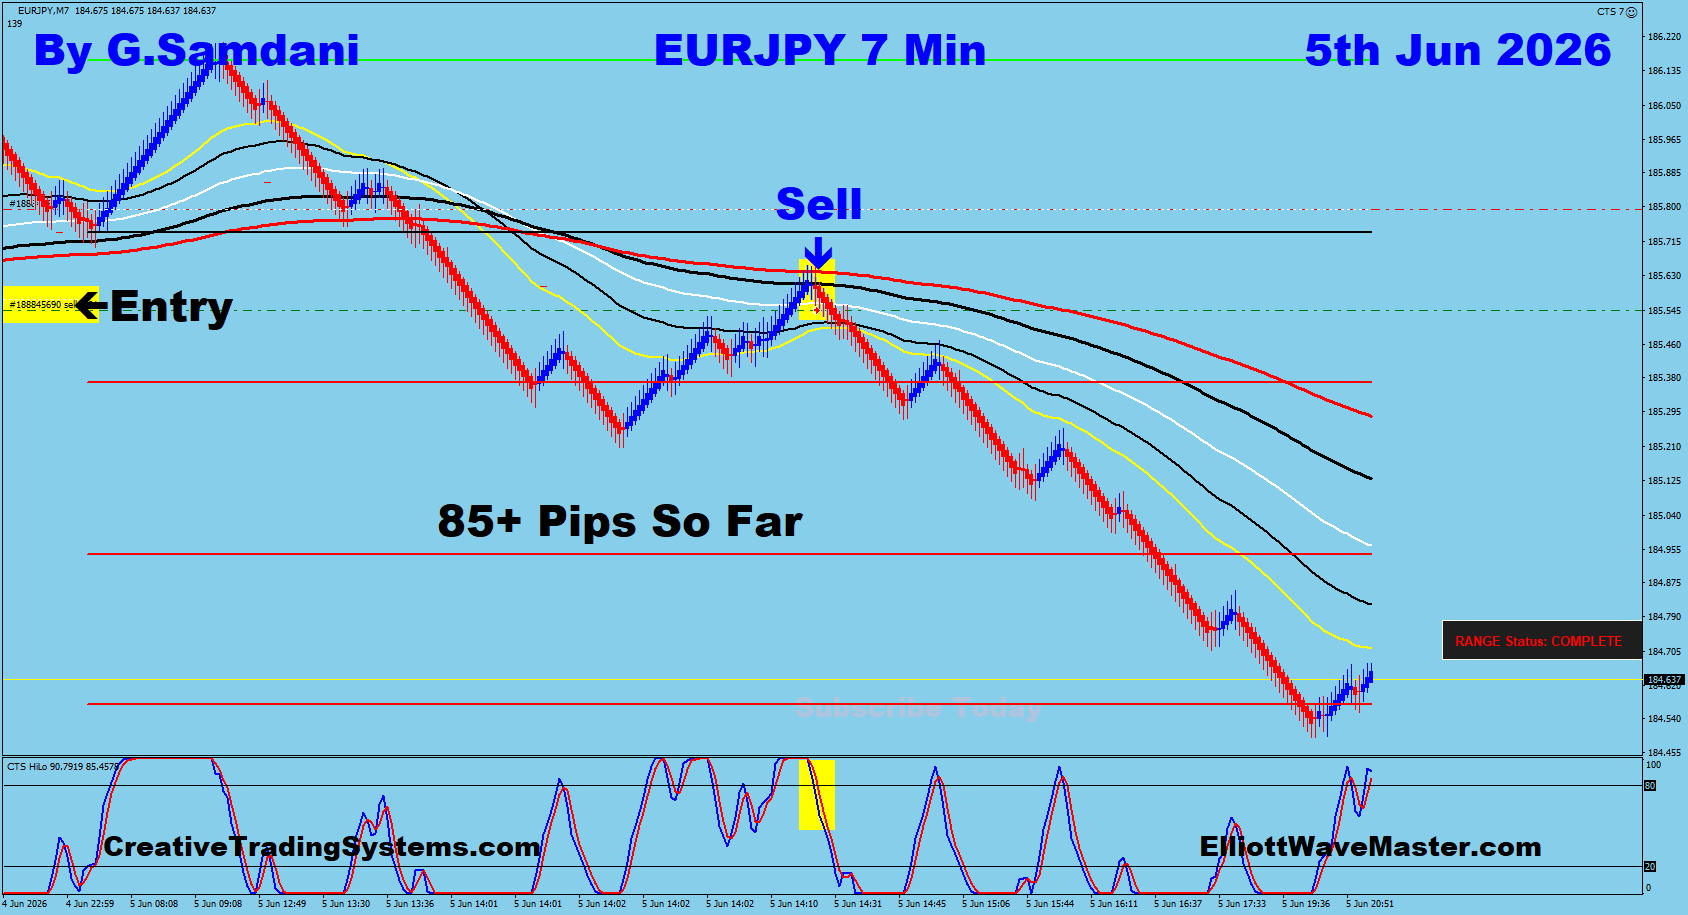
📈 Trades Taken
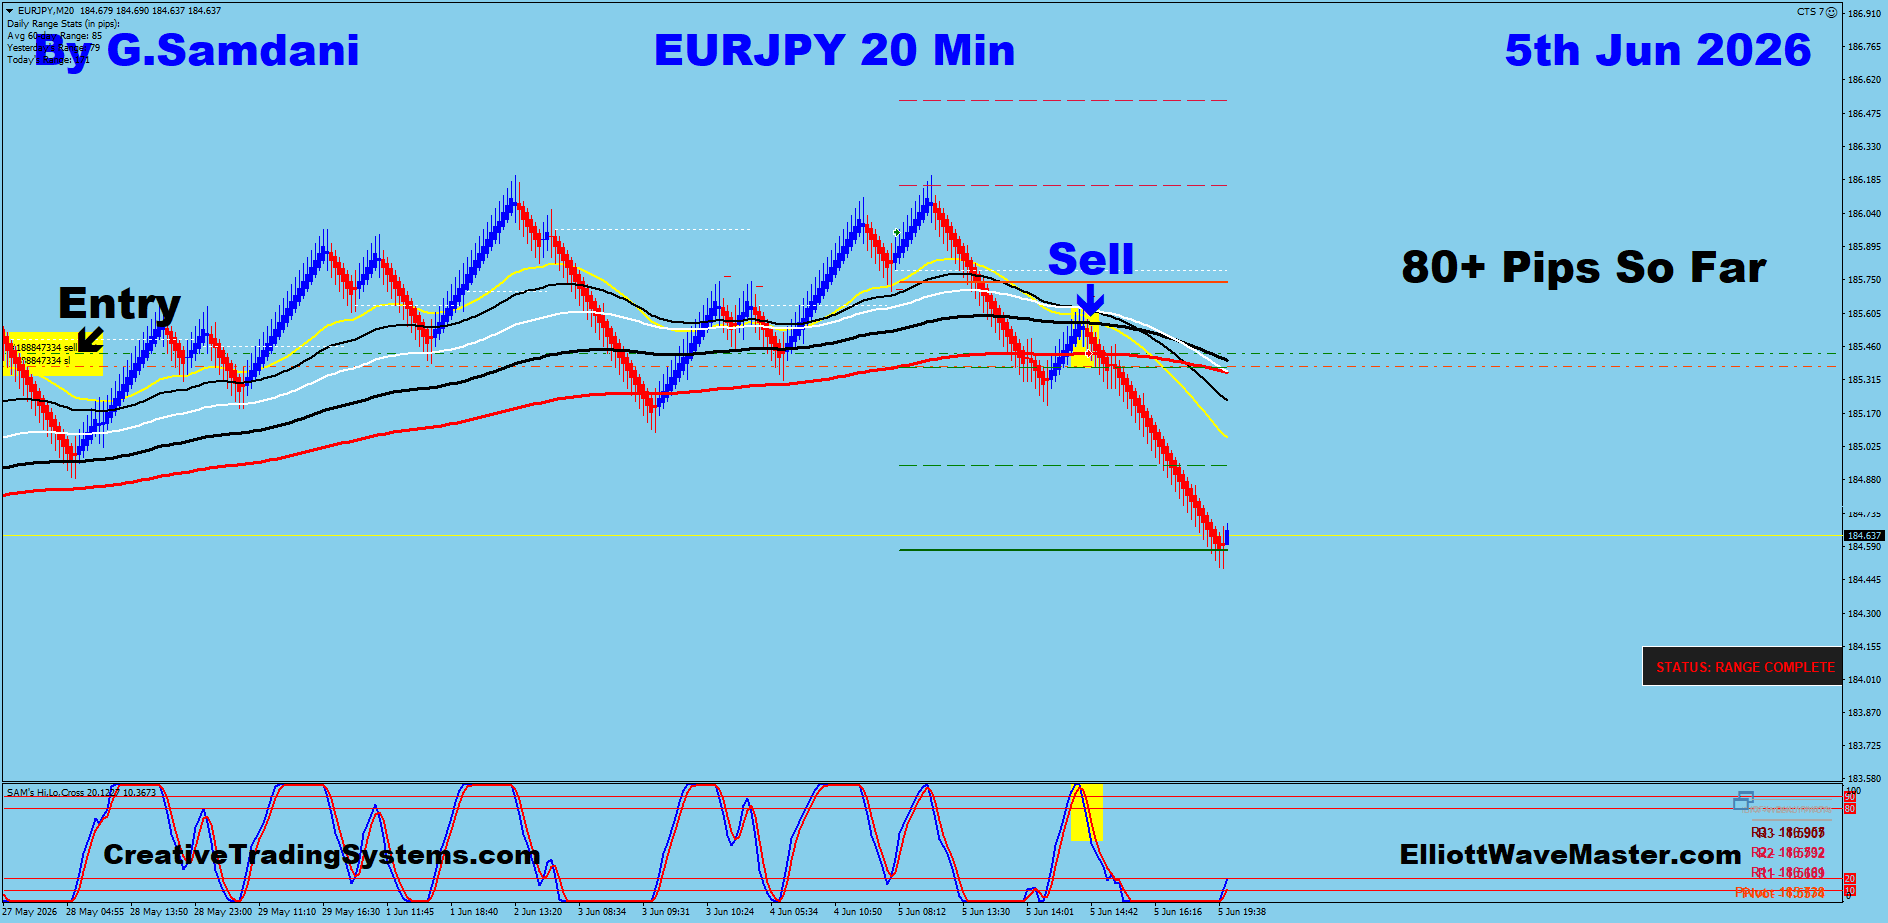
EUR/JPY — 7 Min & 20 Min Entries · June 5
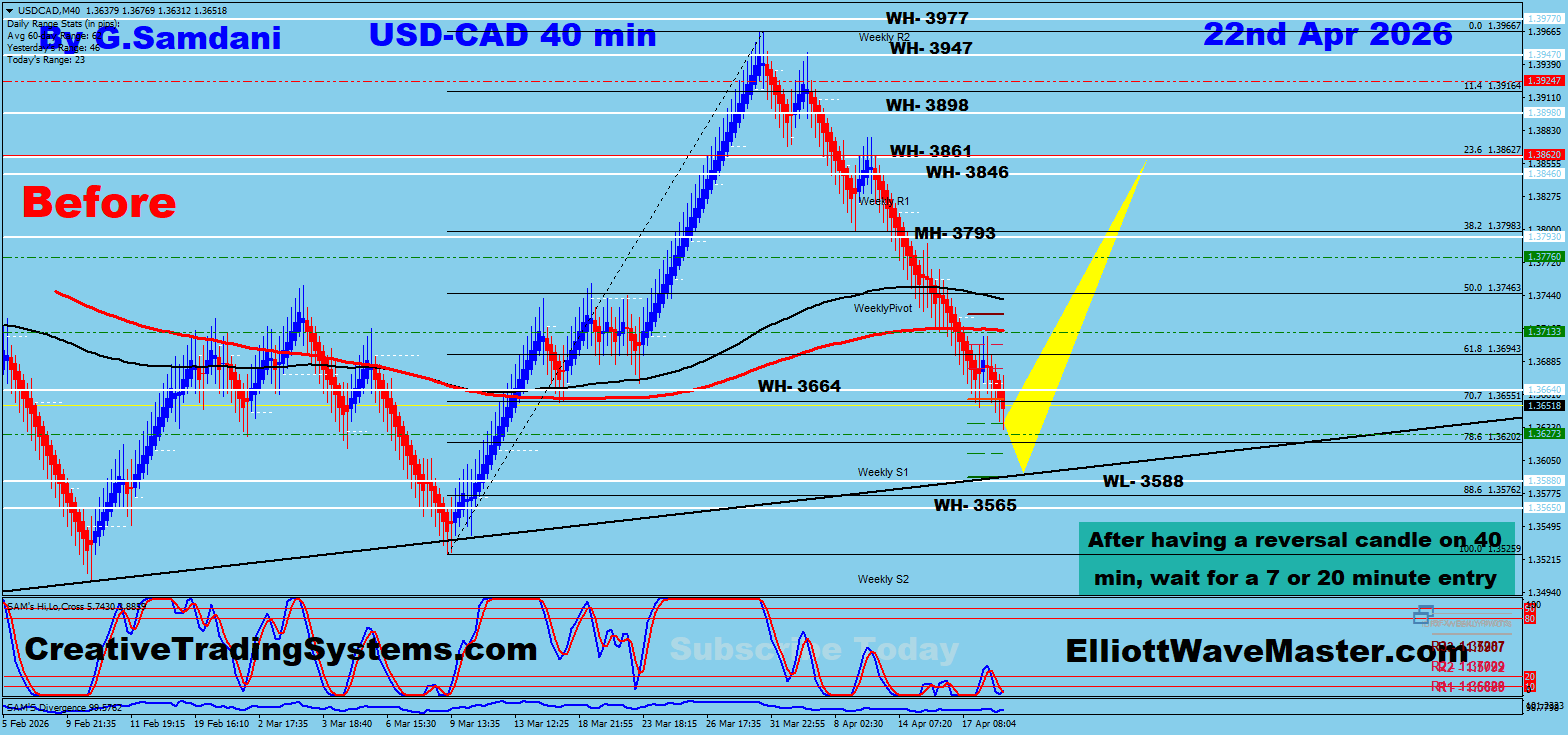
✅ Win
Before
April 22 — Marked-up analysis
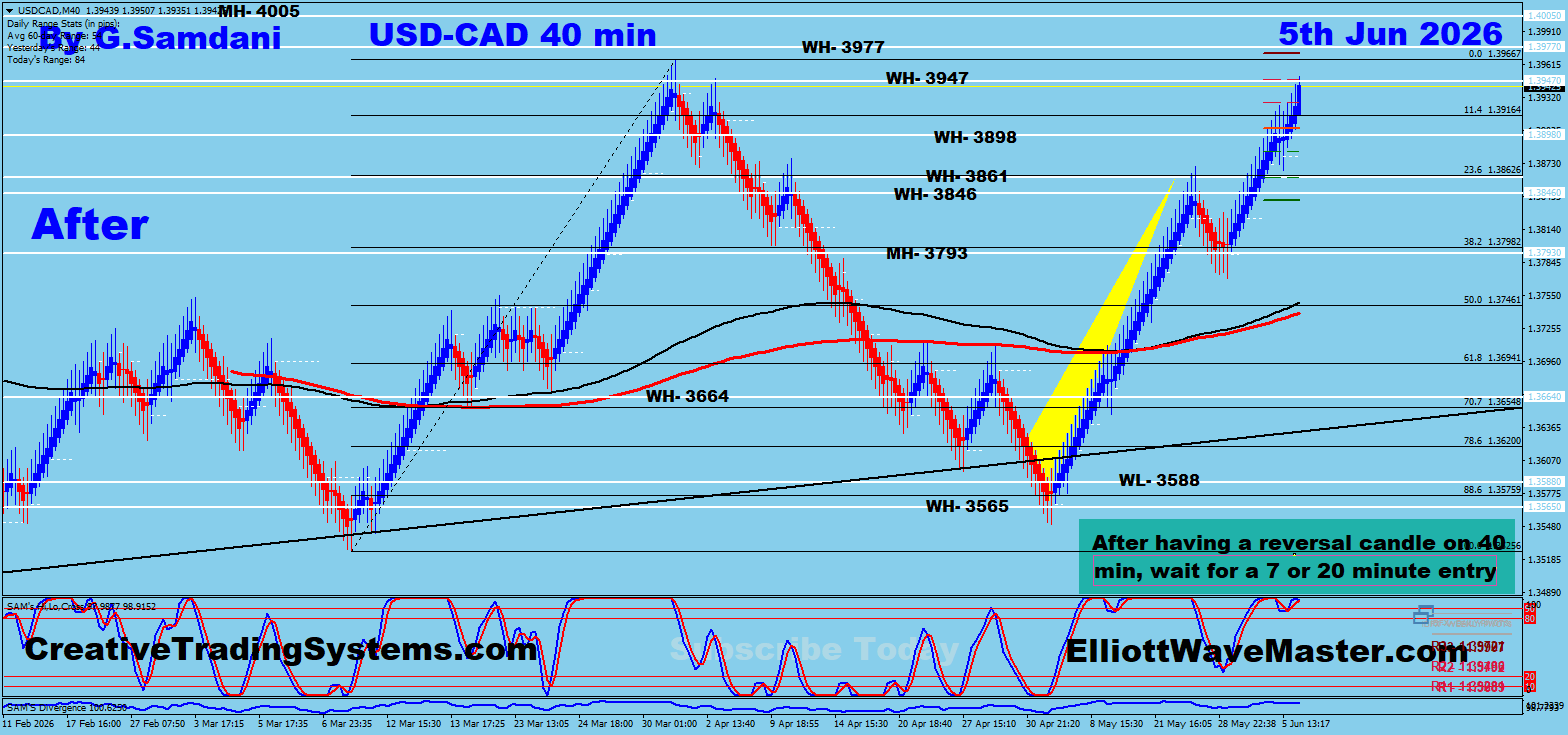
After
June 5 — Market outcome
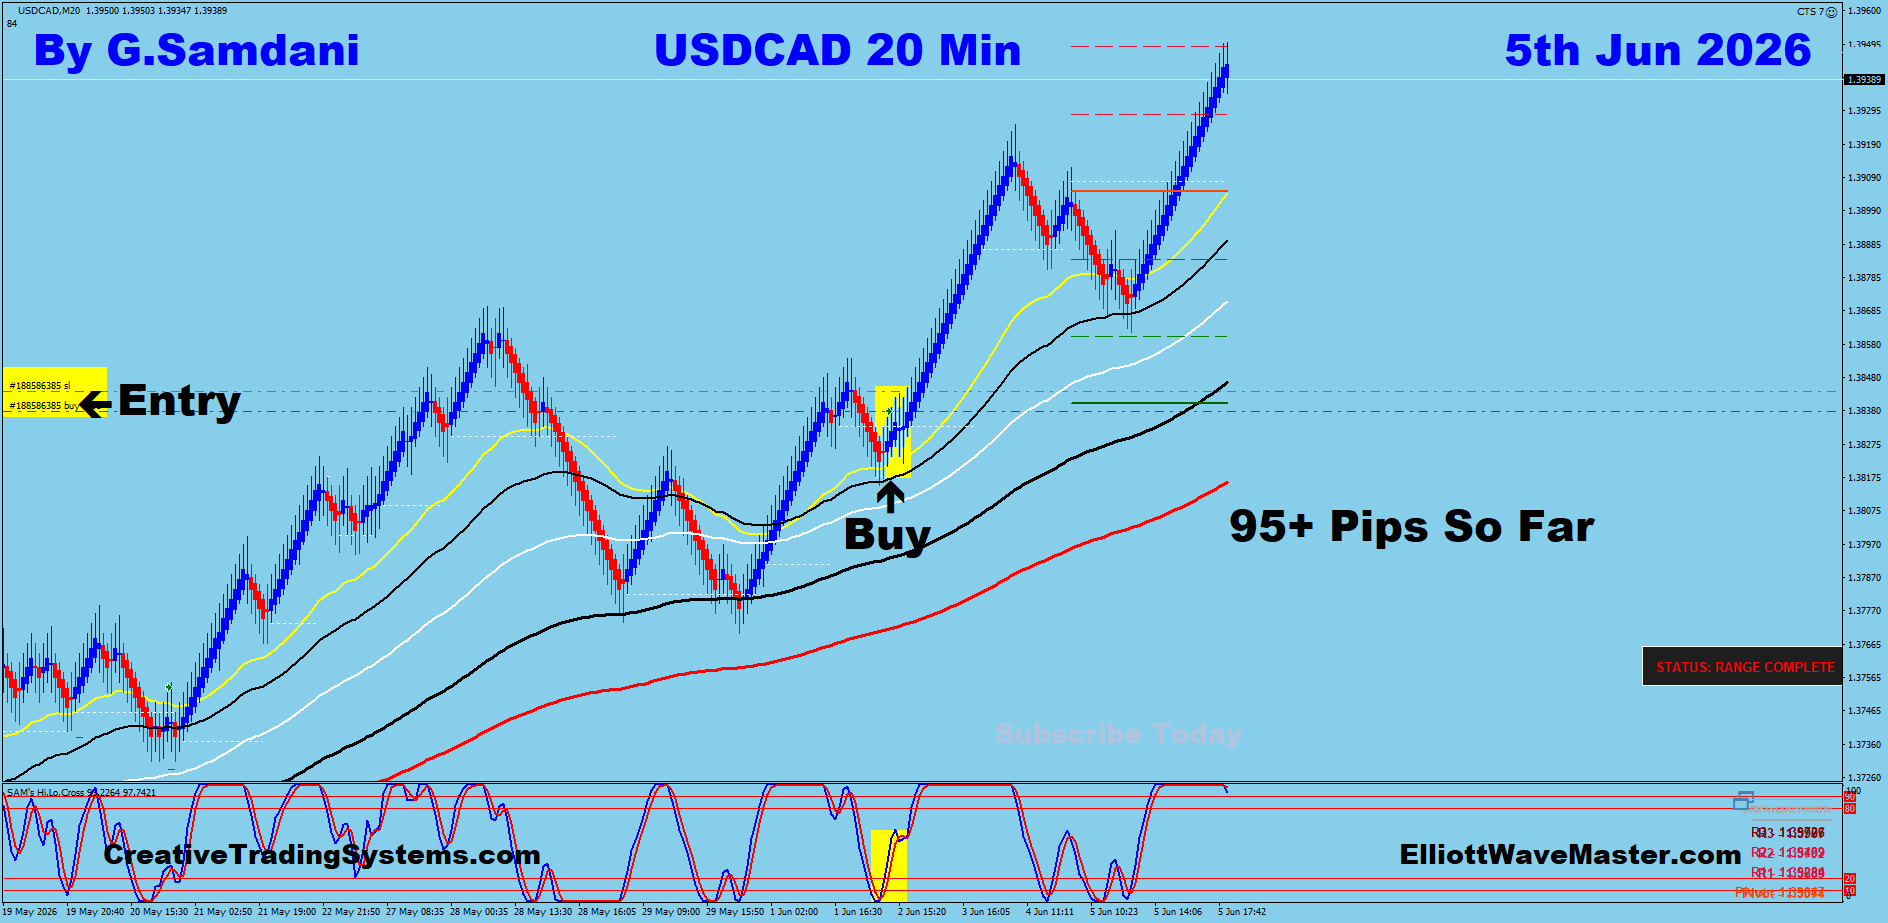
📈 Trade Taken
USD/CAD — 20 Min Entry · June 5
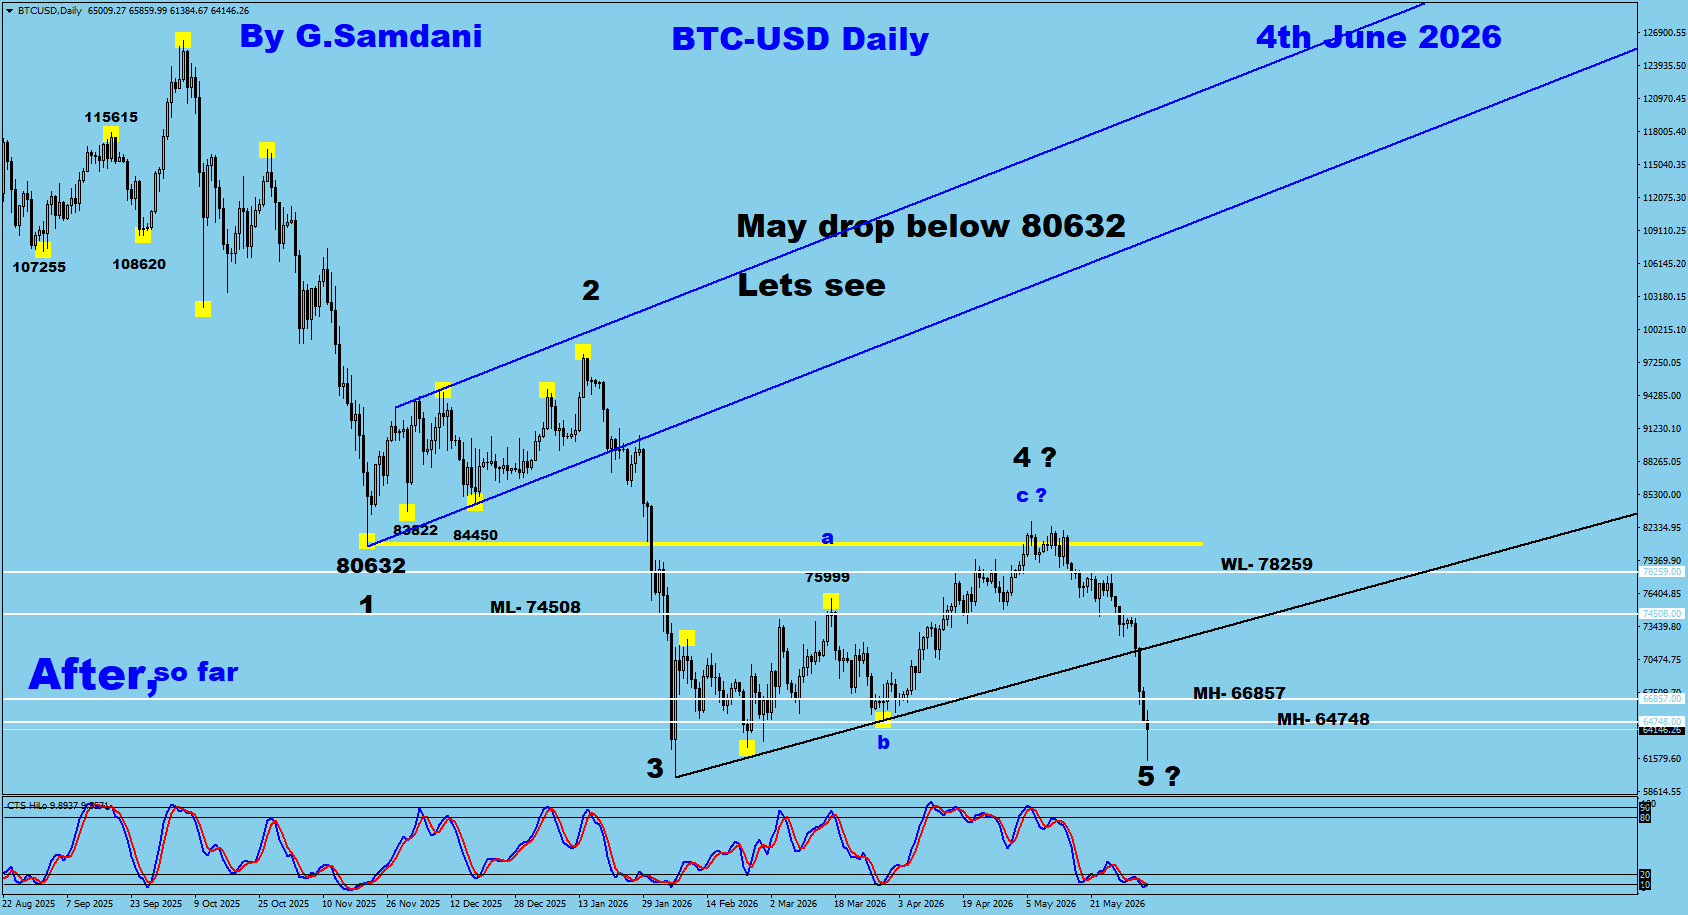
⏳ Developing
Before
May 4 — Marked-up analysis
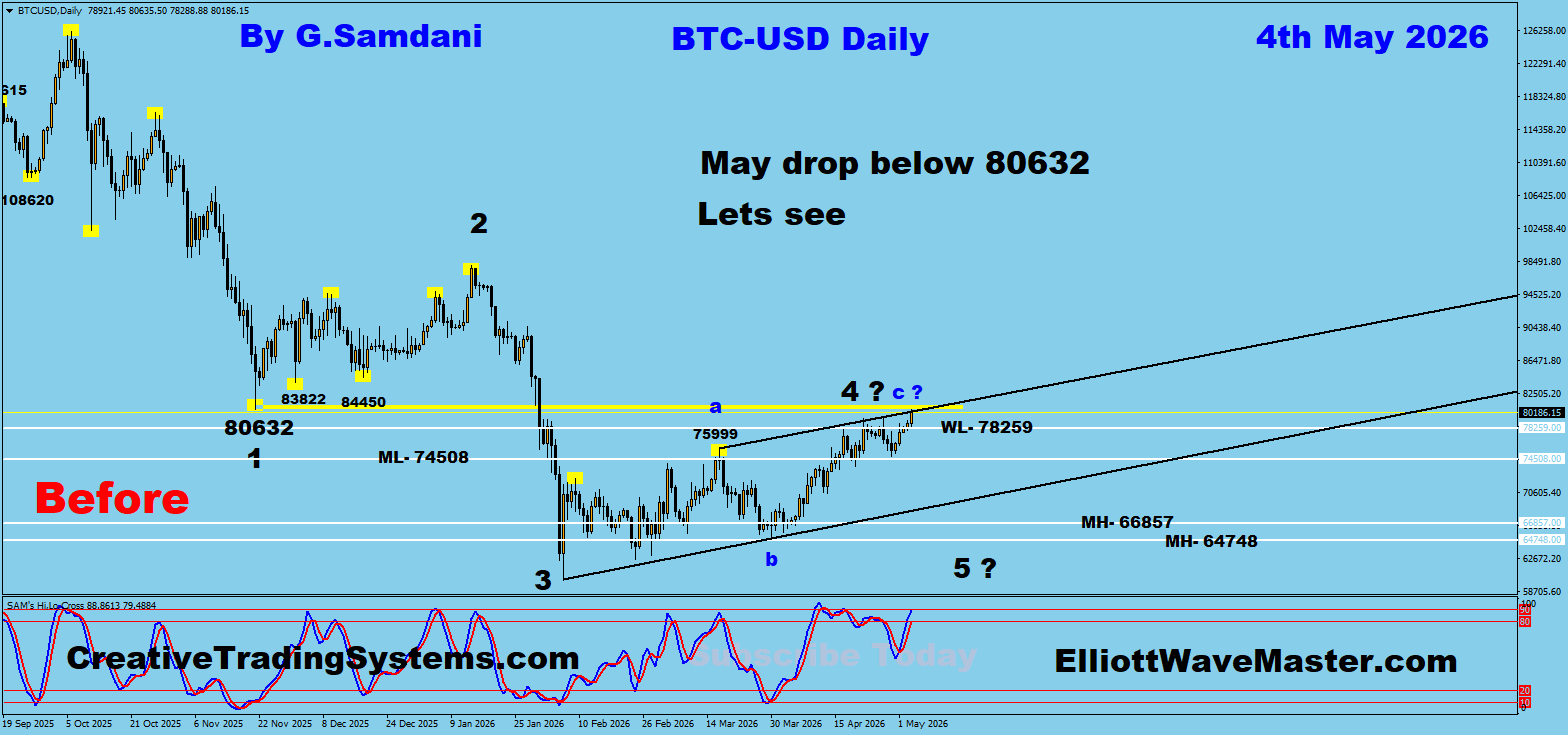
After
June 2 — After so far
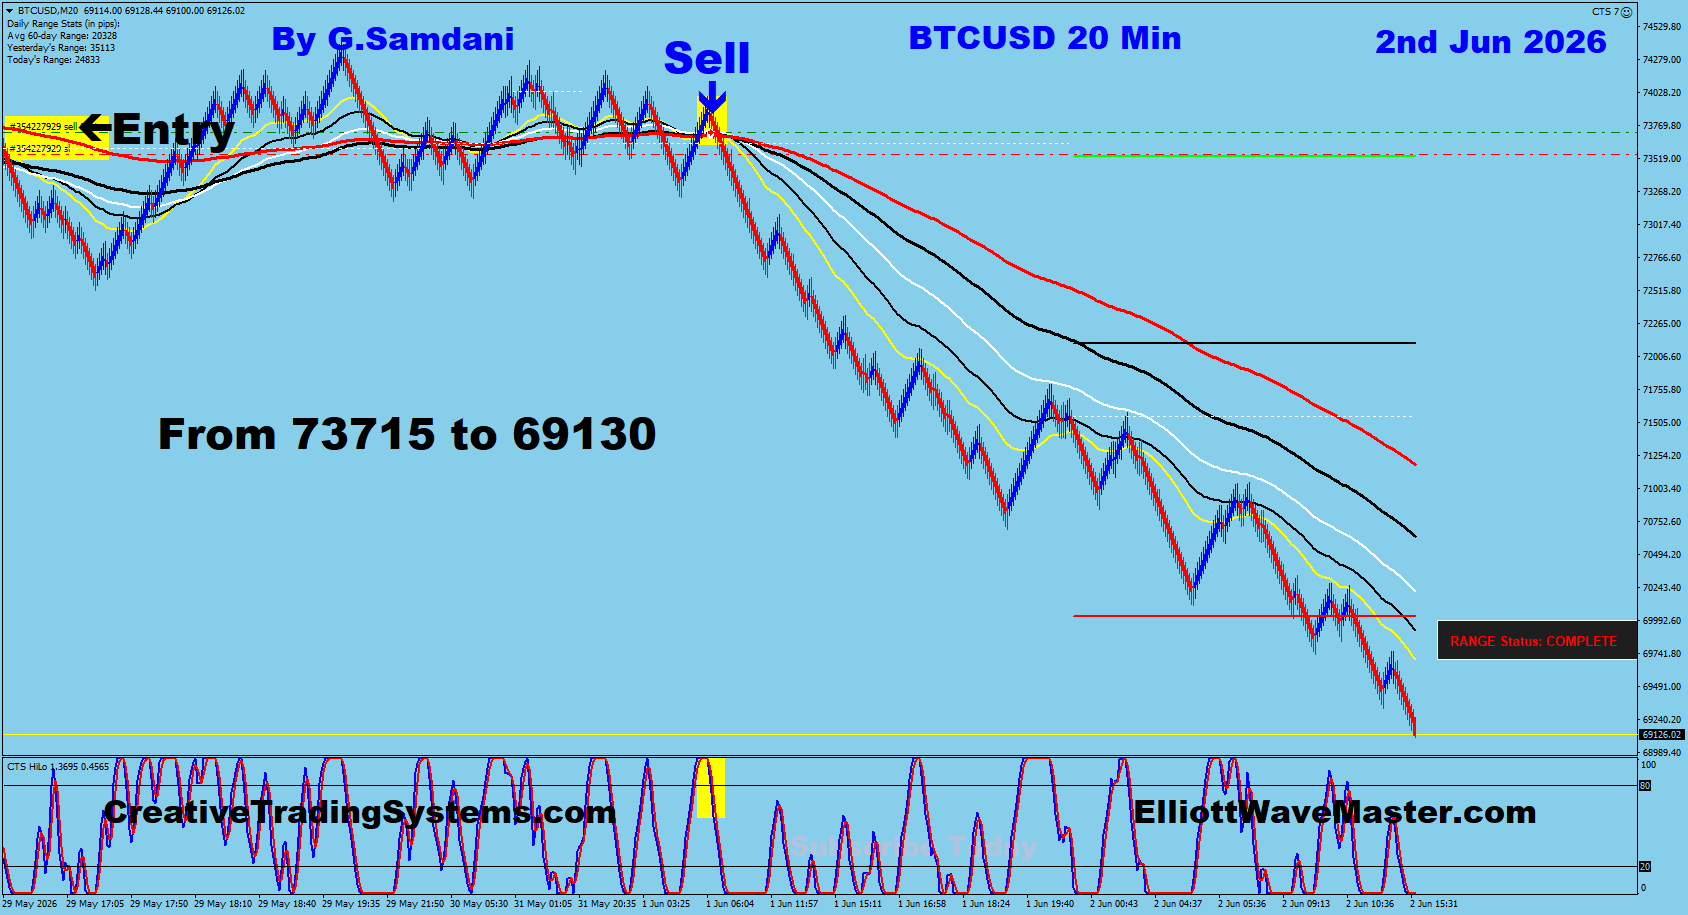
📈 Trade Taken
Bitcoin — 20 Min Entry · June 2
✅ Win
Before
May 29 — Marked-up analysis
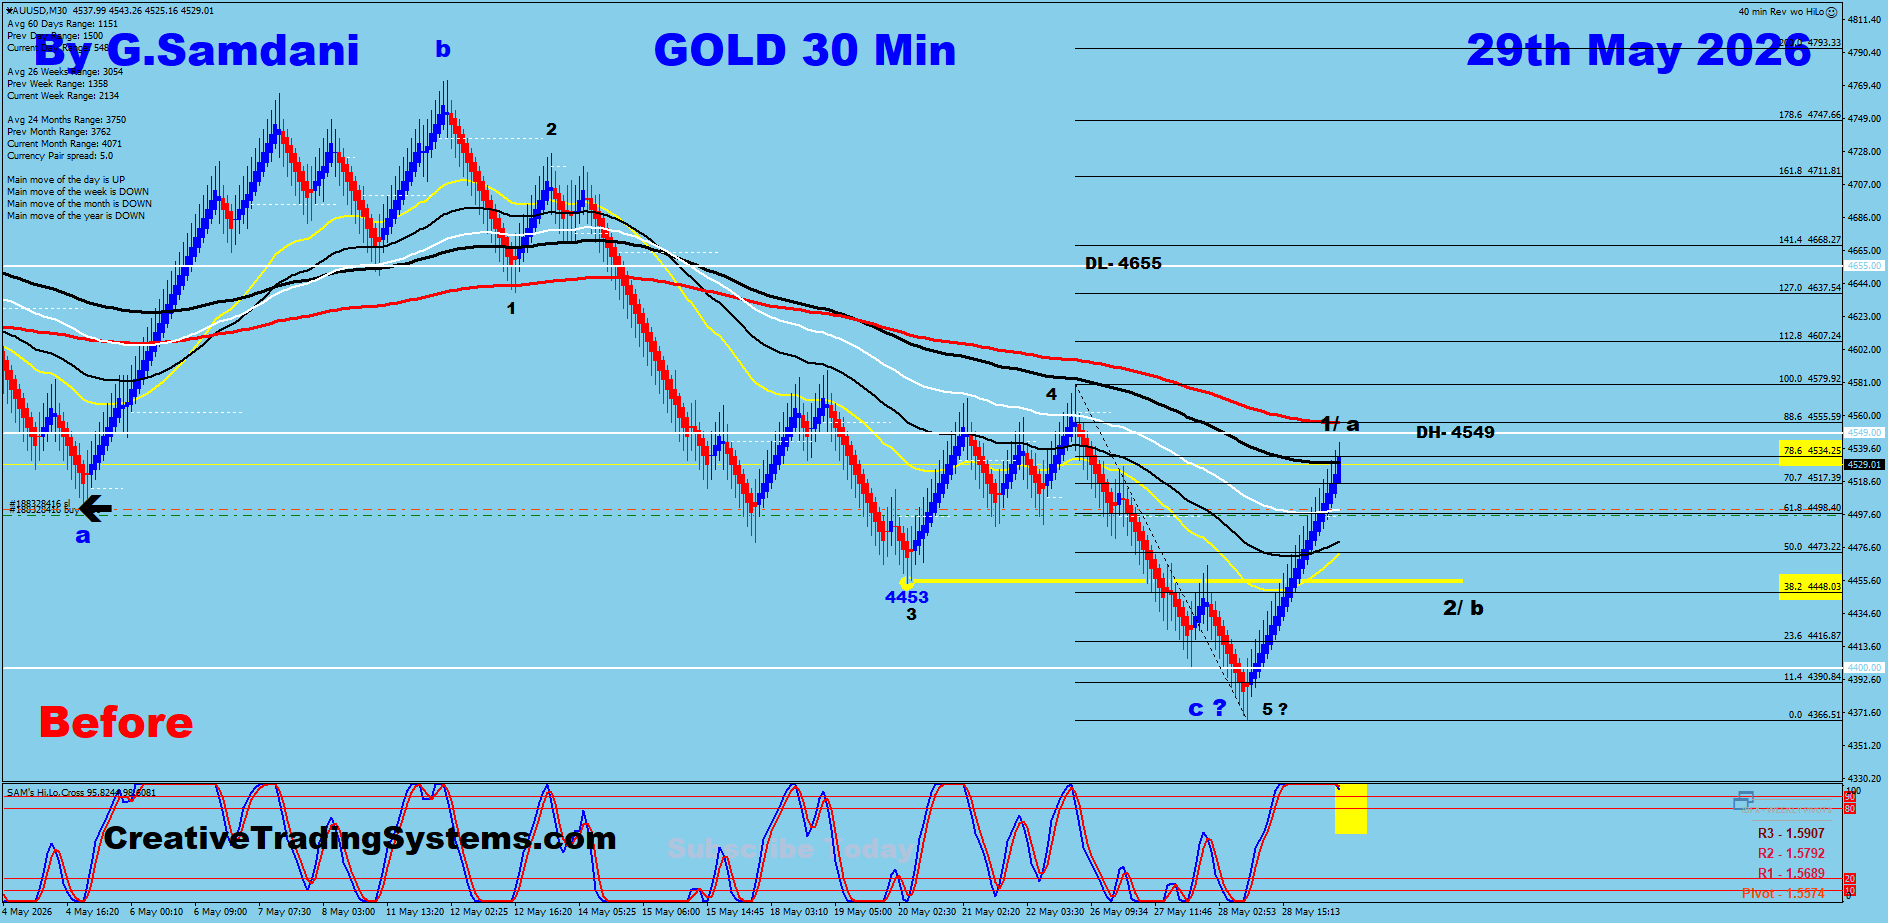
After
June 1 — Market outcome
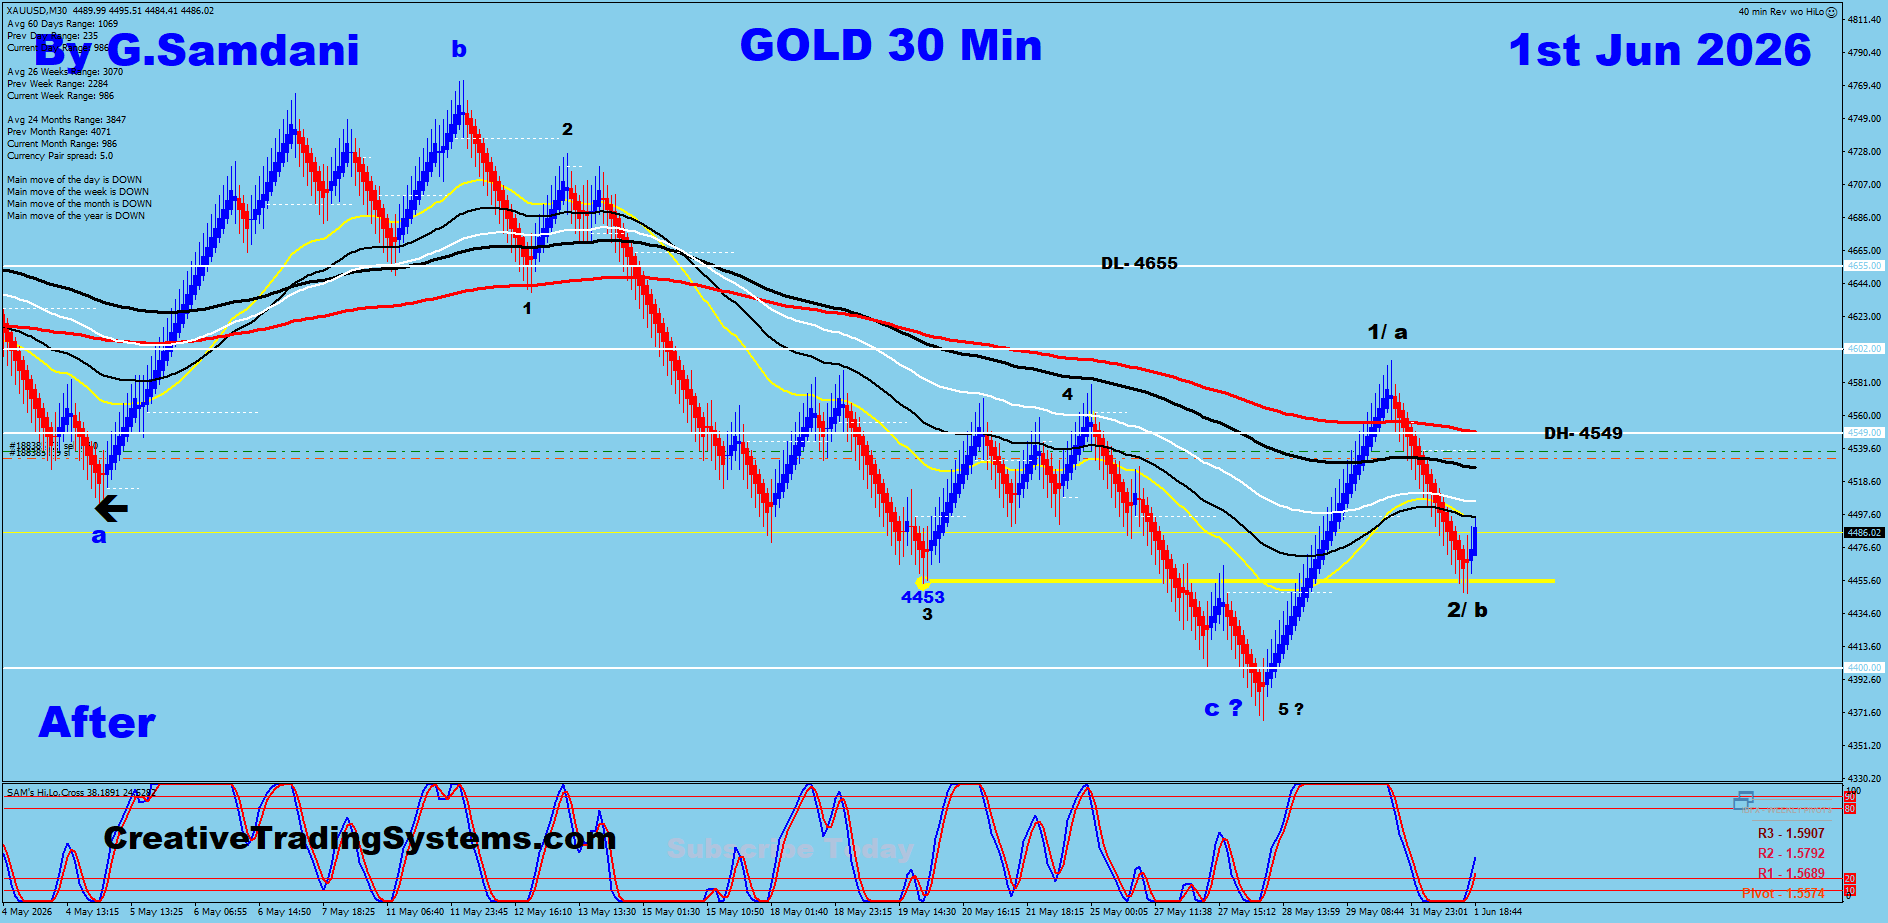
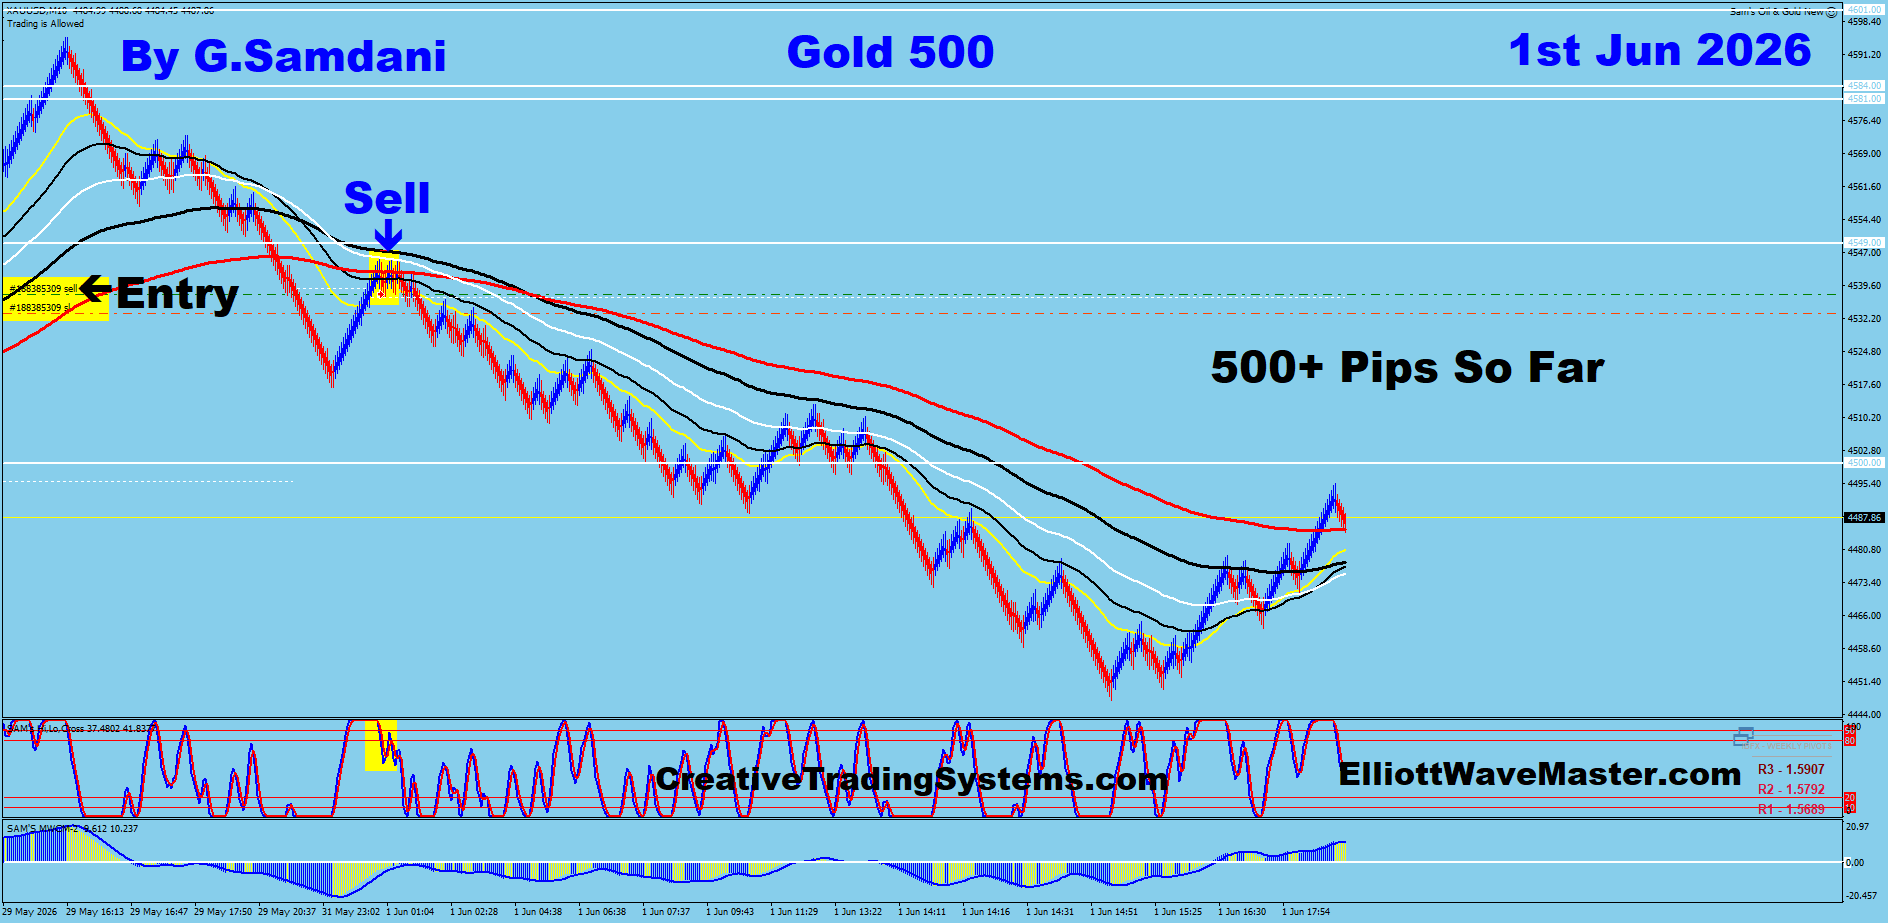
📈 Trade Taken
Gold — 500 Renko · June 1
✅ Win
Before
May 29 — Marked-up analysis
After
June 1 — Market outcome
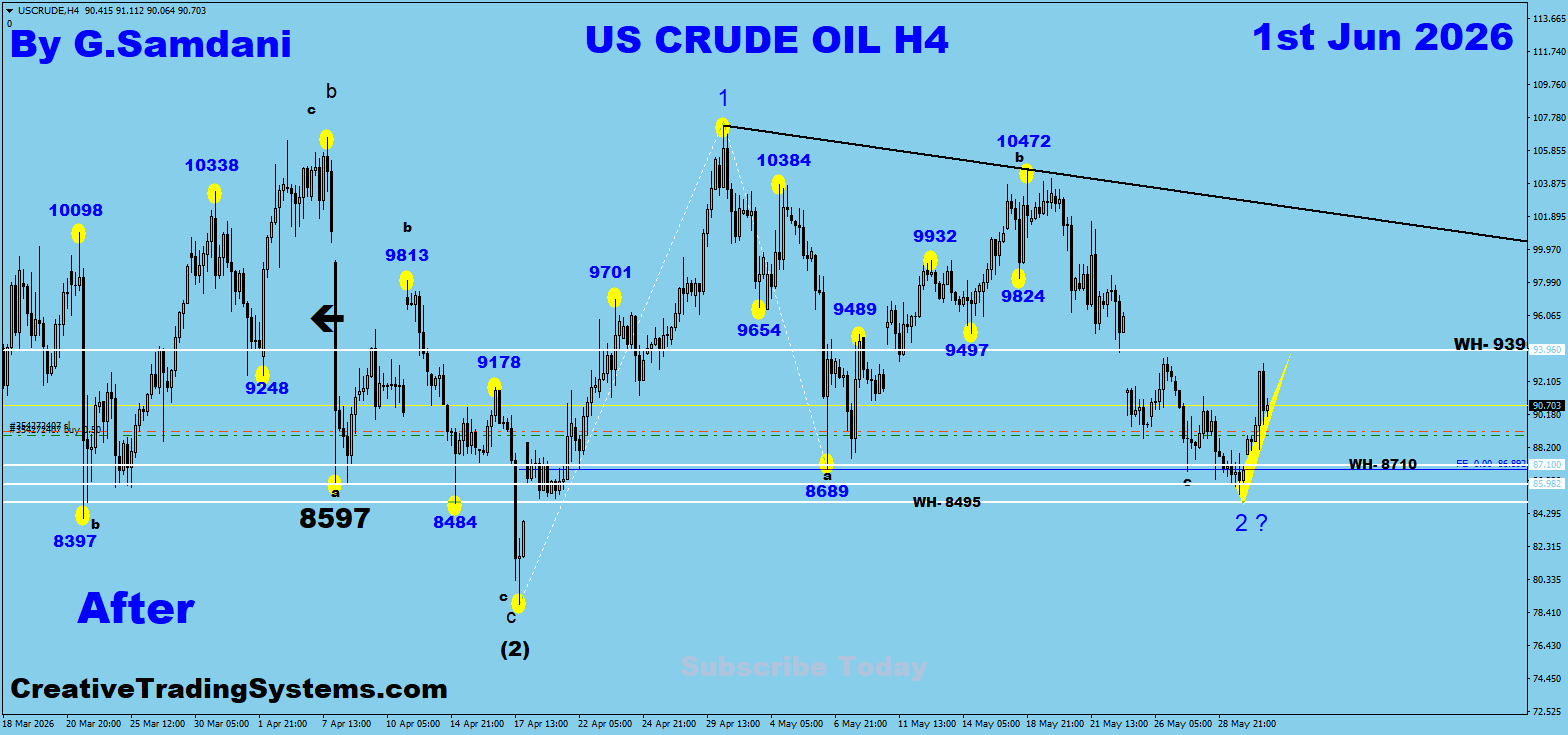
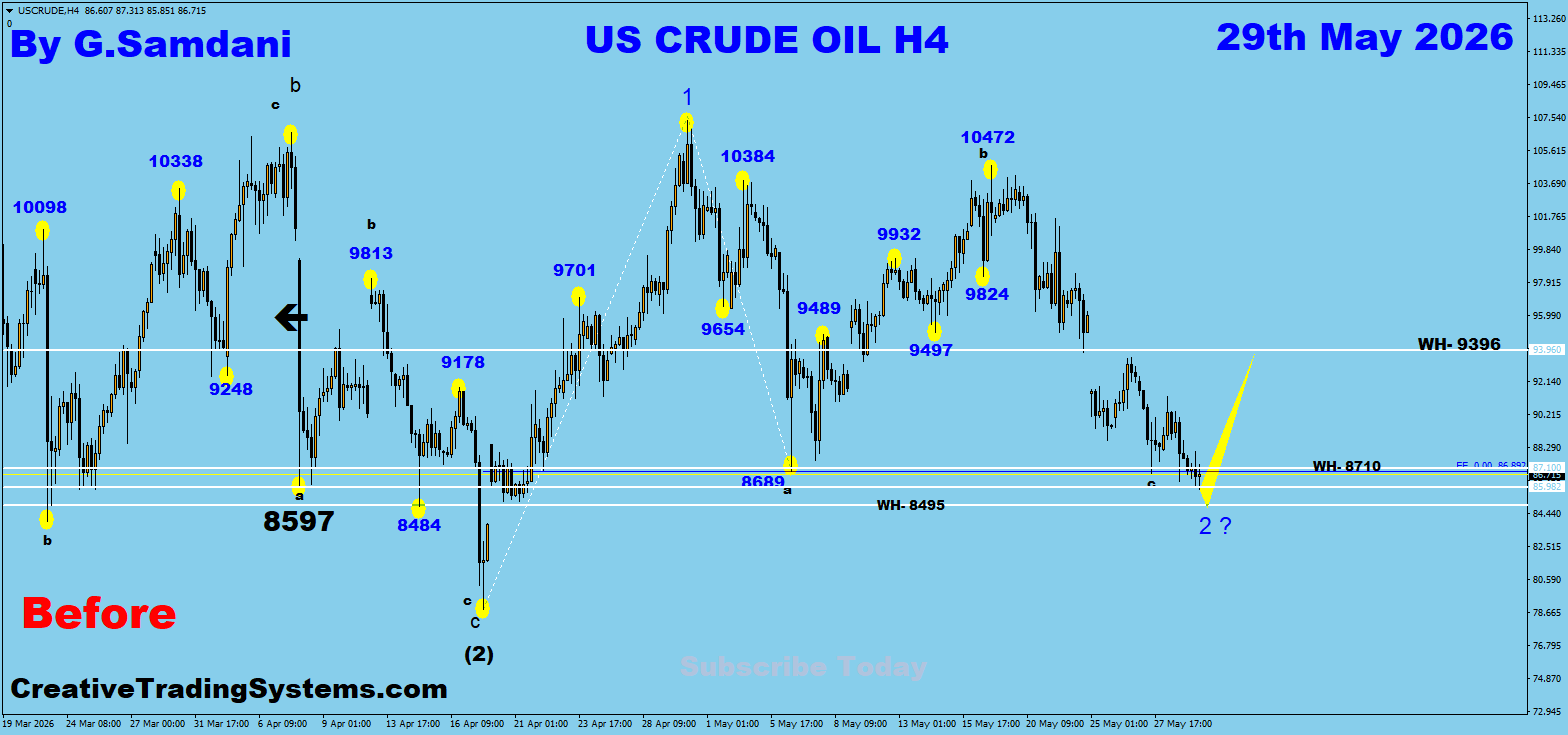
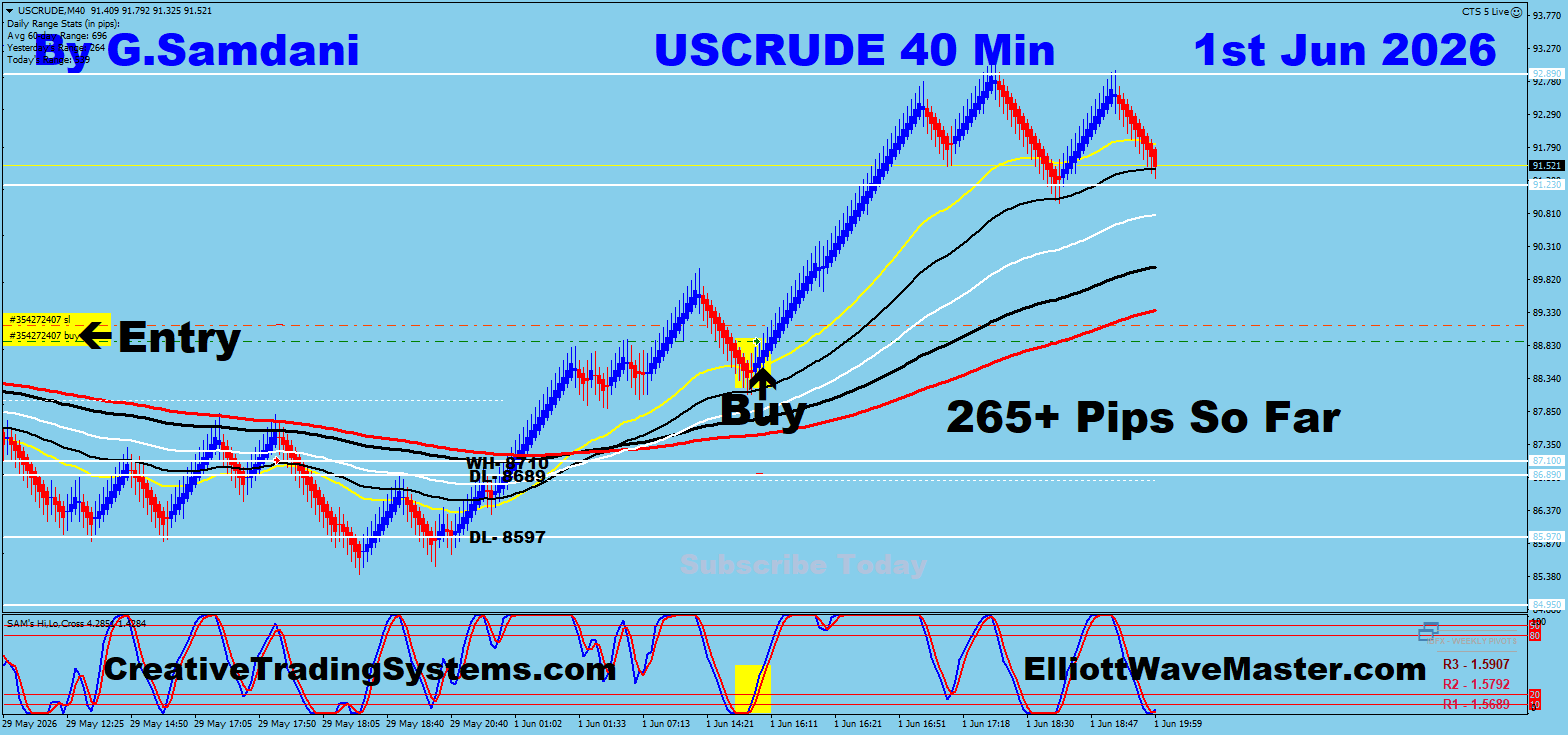
📈 Trade Taken
Oil — 40 Min Entry · June 1
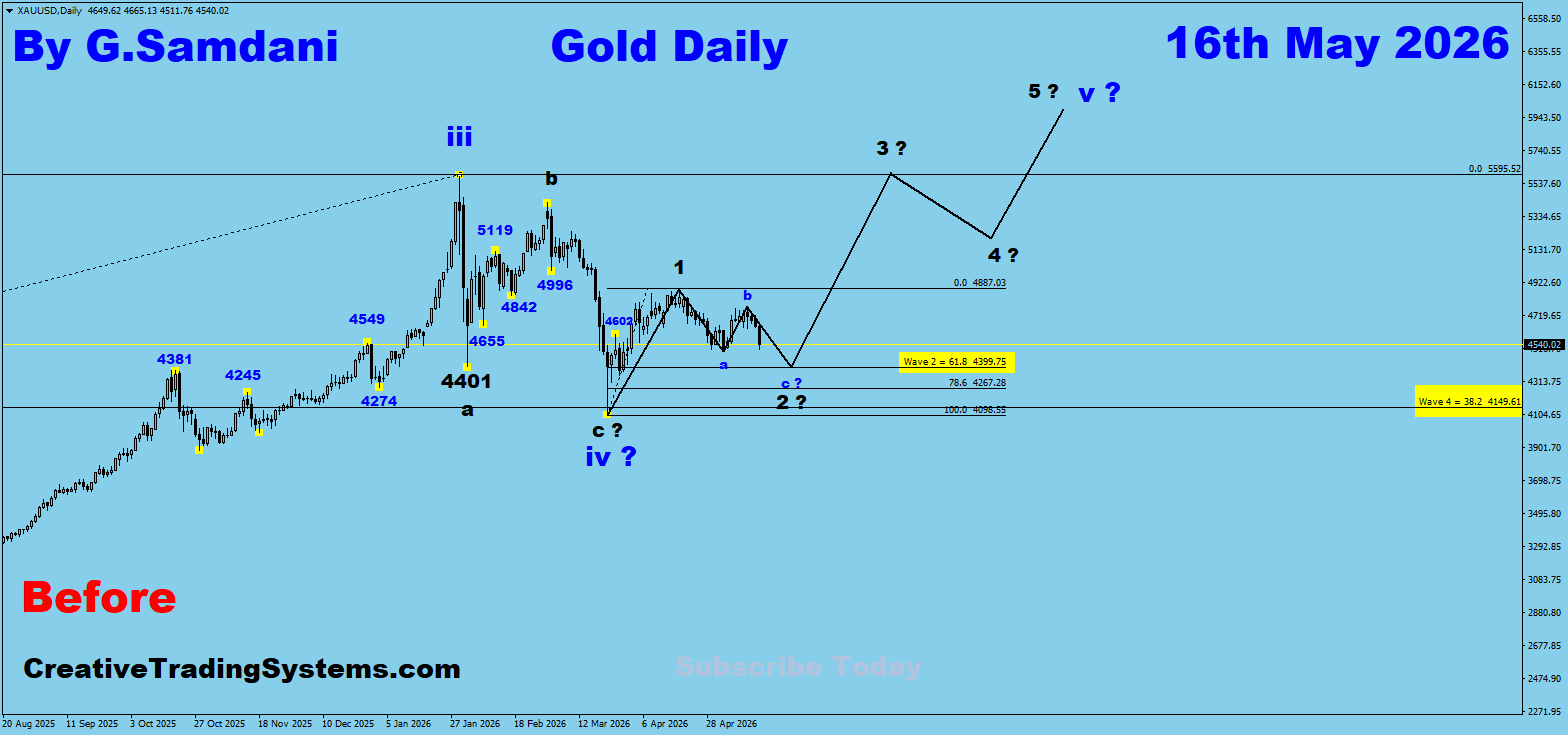
✅ Win
Before
May 16 — Marked-up analysis
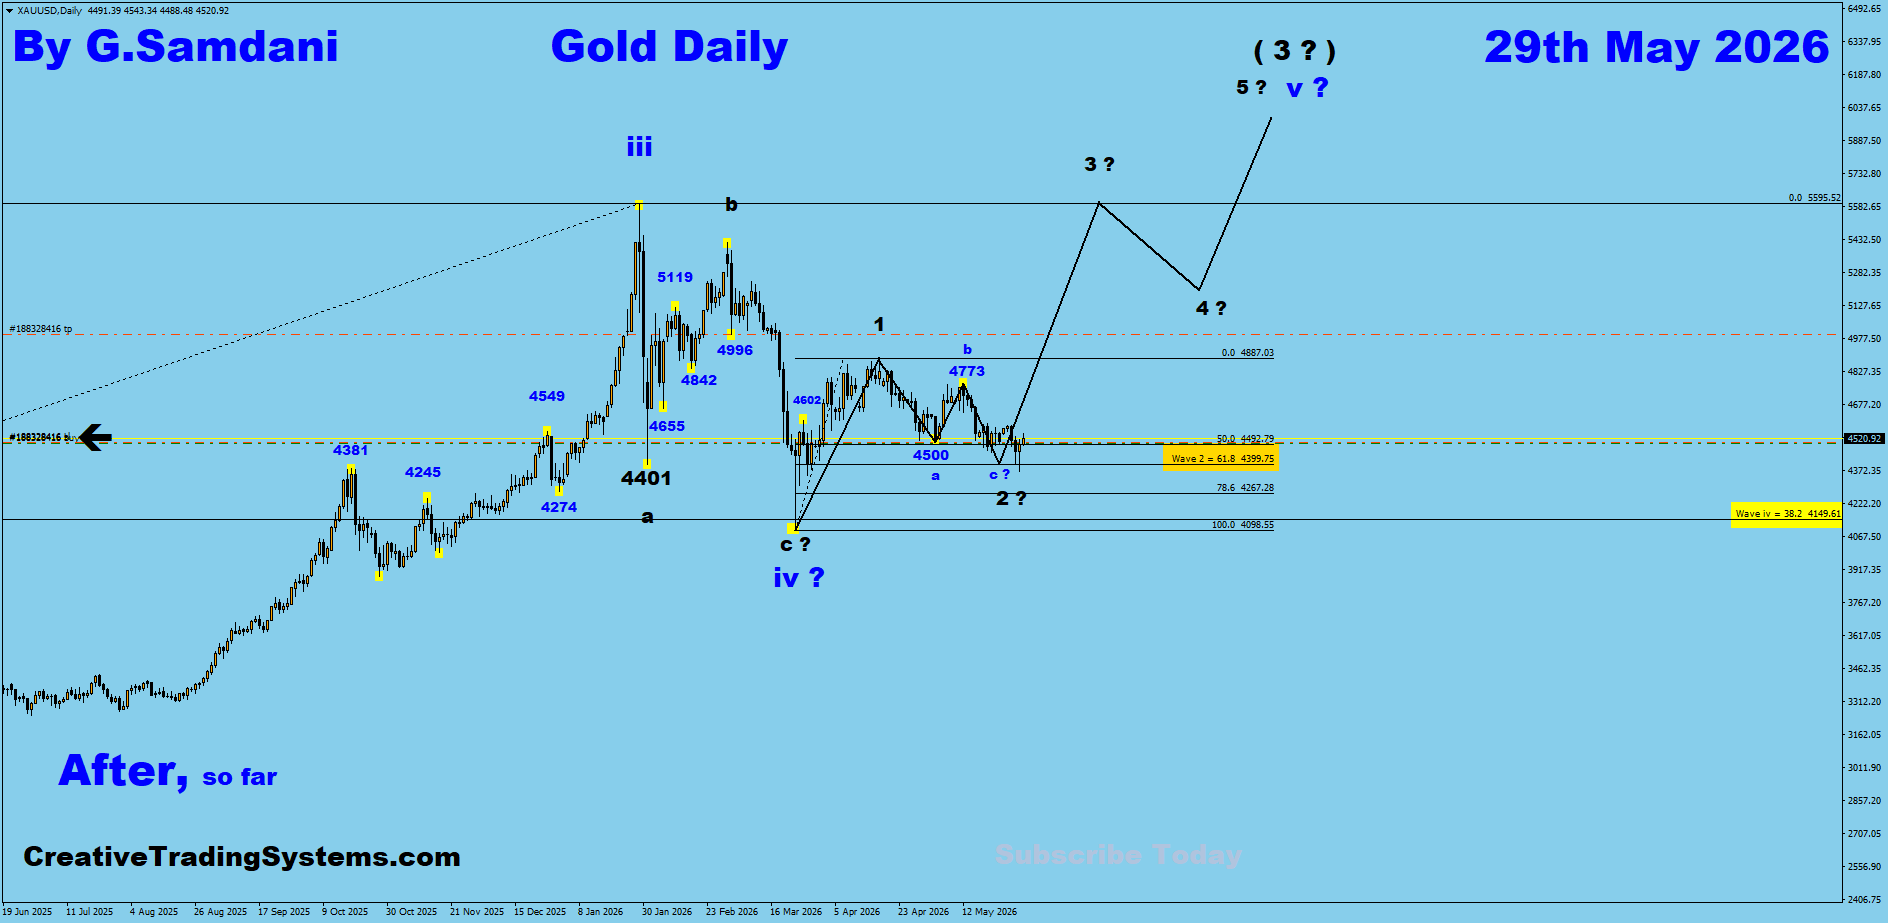
After
May 29 — Market outcome
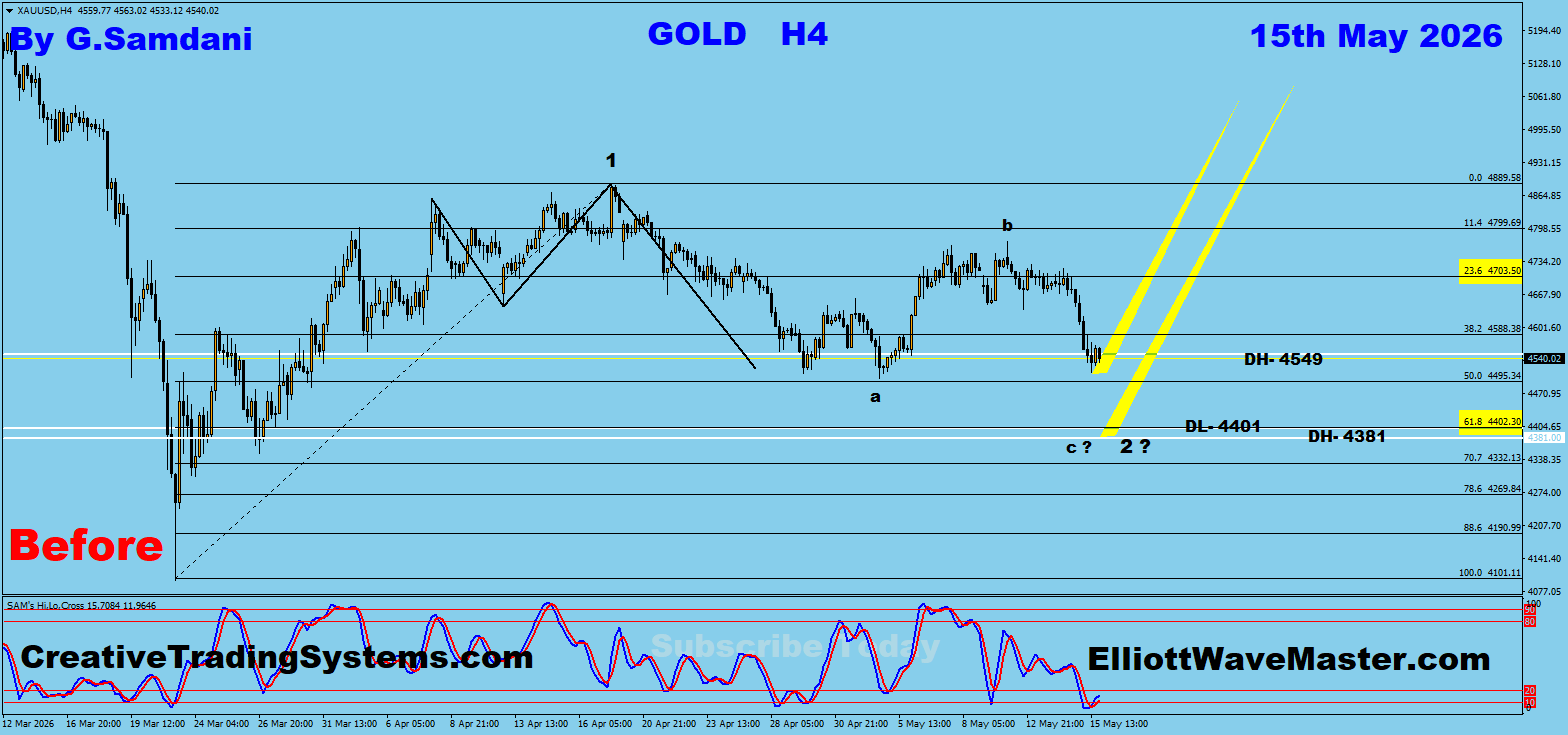
✅ Win
Before
May 16 — Marked-up analysis
After
May 29 — Market outcome
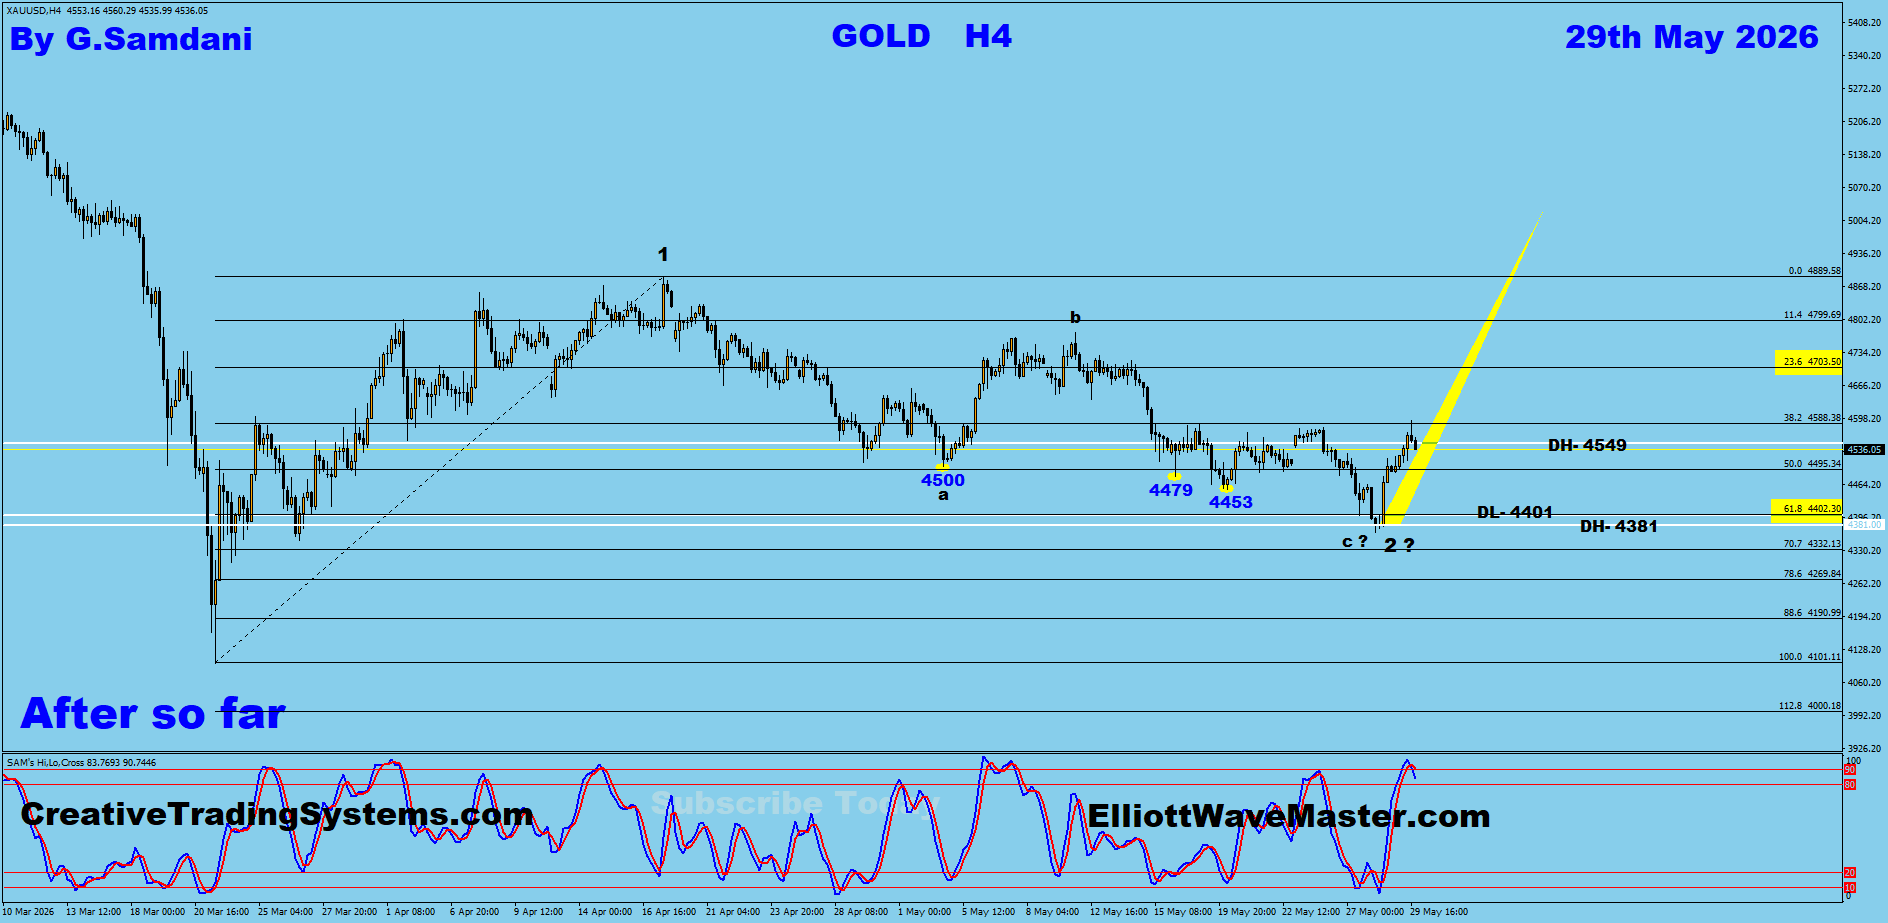
📈 Trades Taken
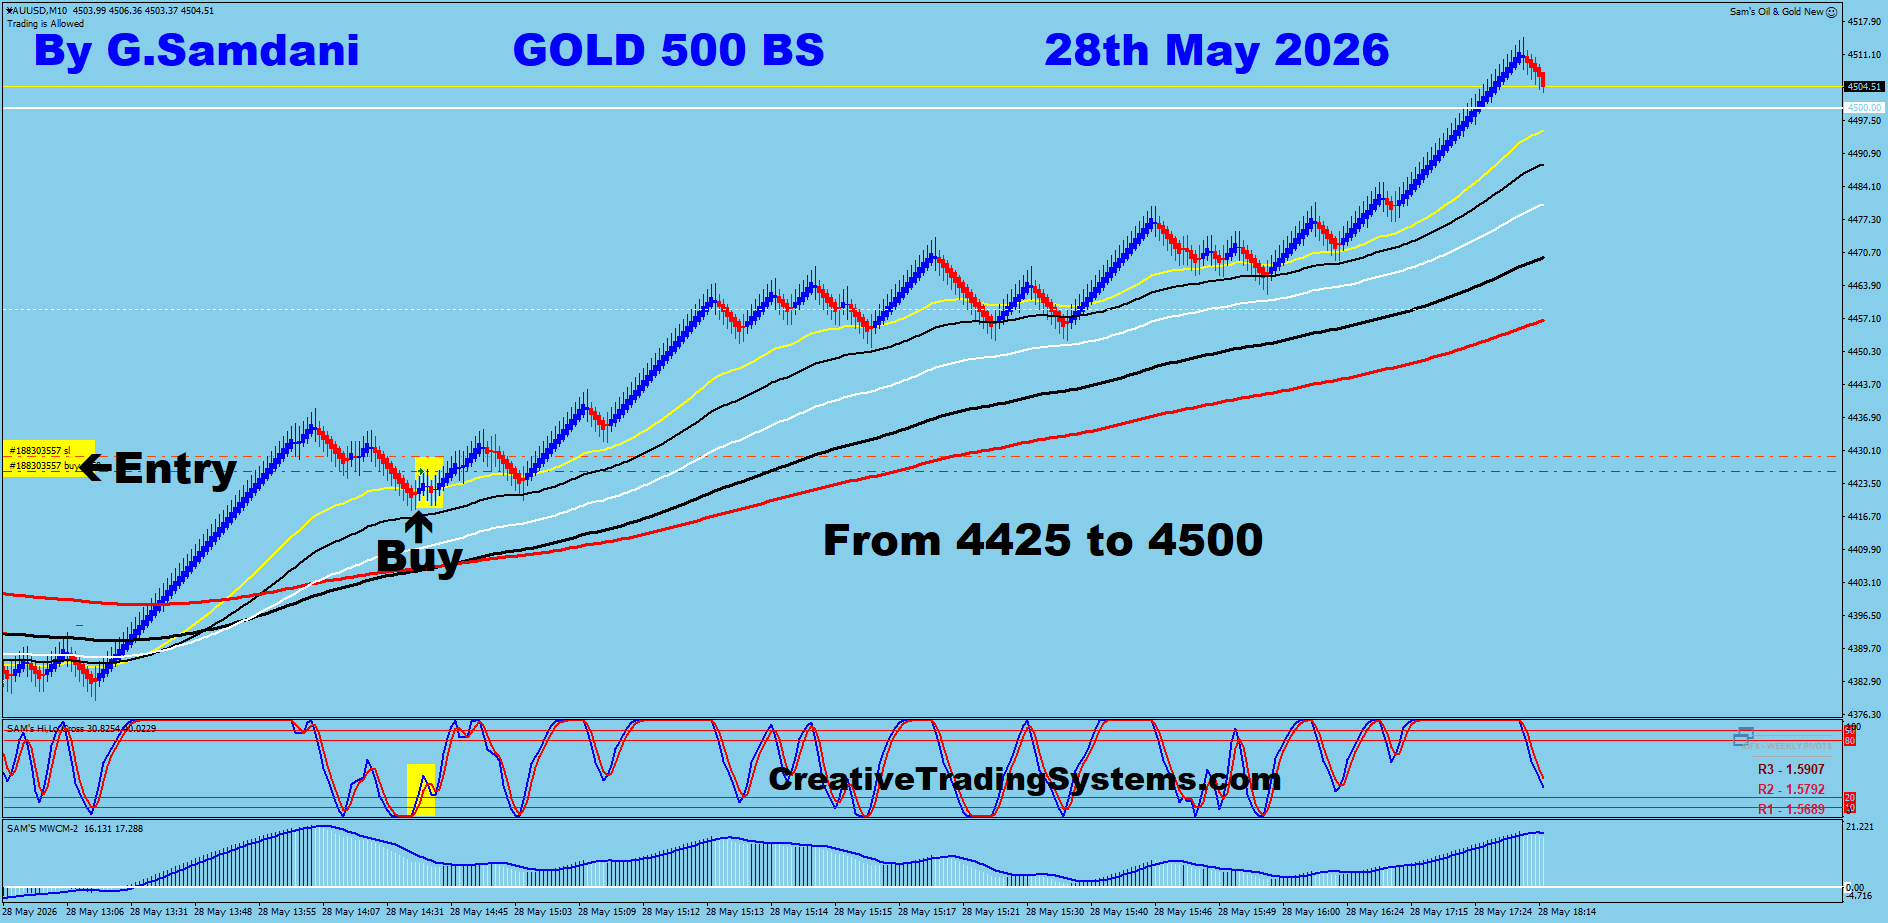
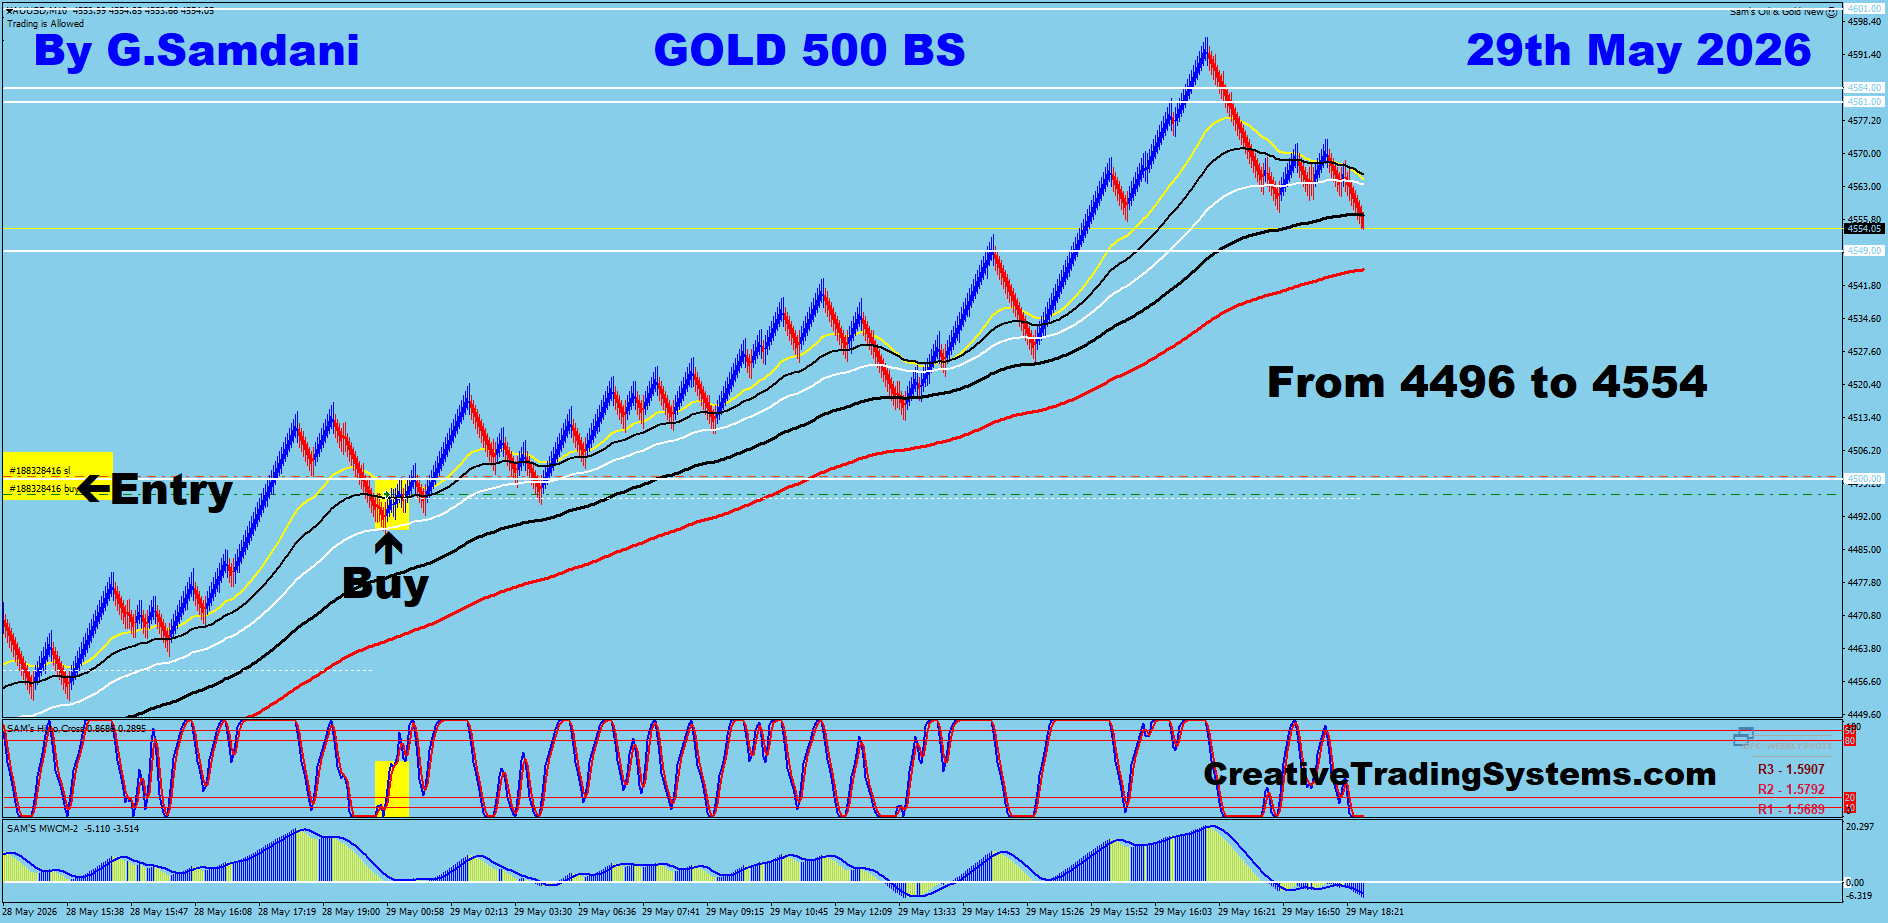
Gold — 500 Renko · May 28 & May 29
✅ Win
Before
May 3 — Marked-up analysis
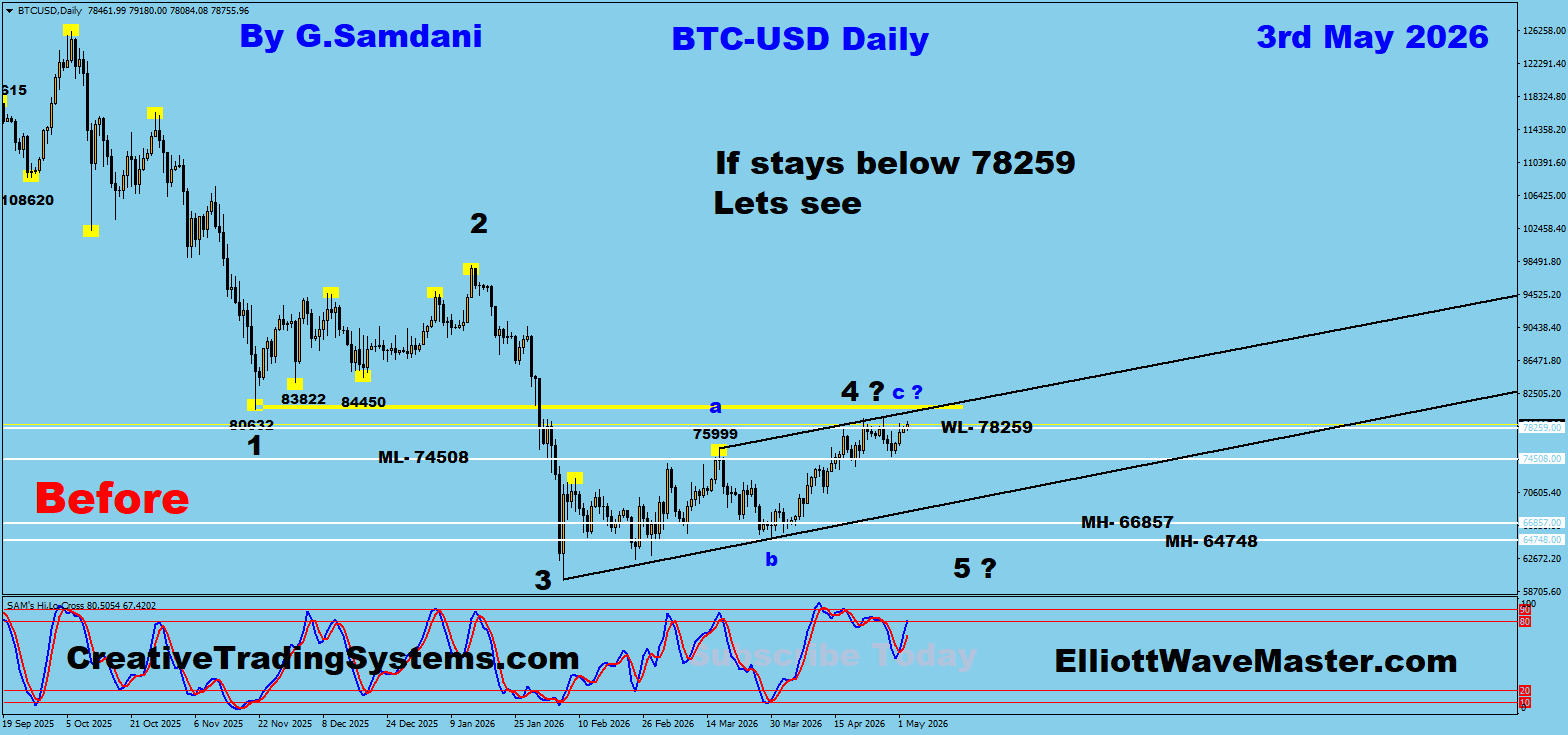
After
May 28 — Market outcome
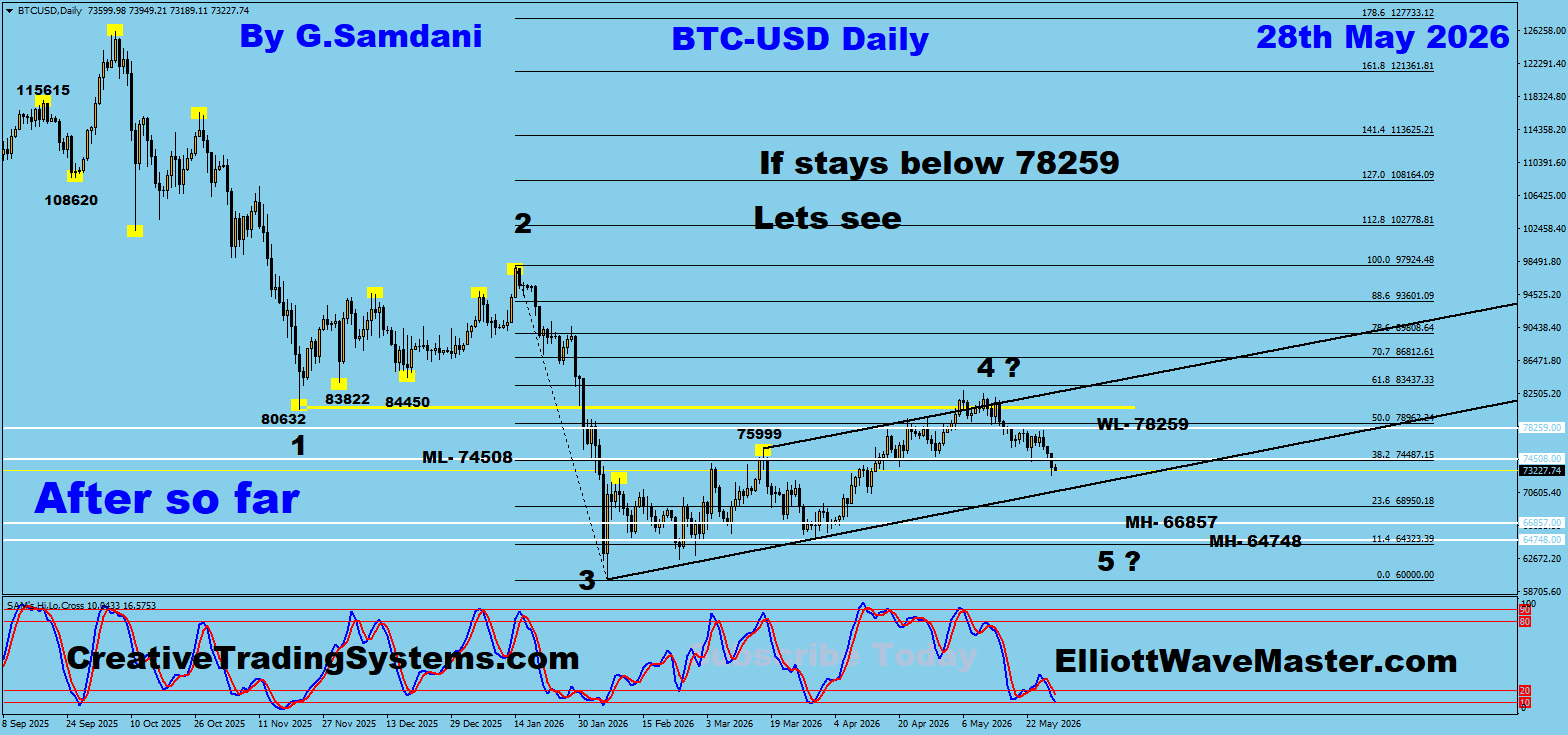
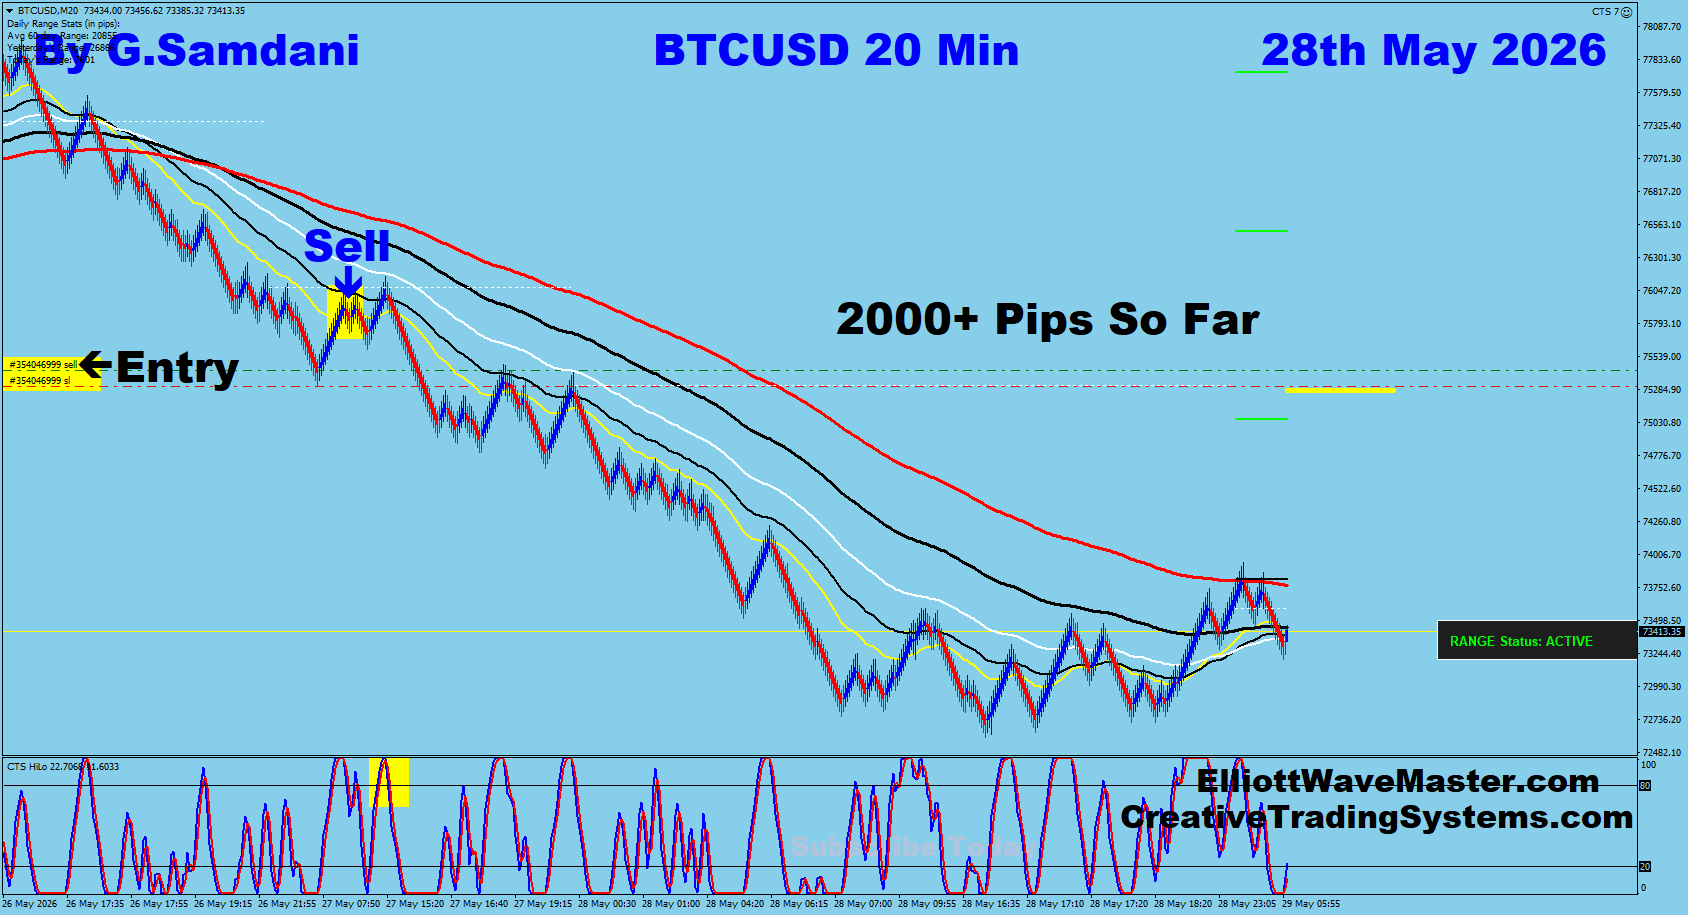
📈 Trade Taken
Bitcoin Long — 20 Min Entry · May 28
⏳ Developing
Before
May 20 — Marked-up analysis
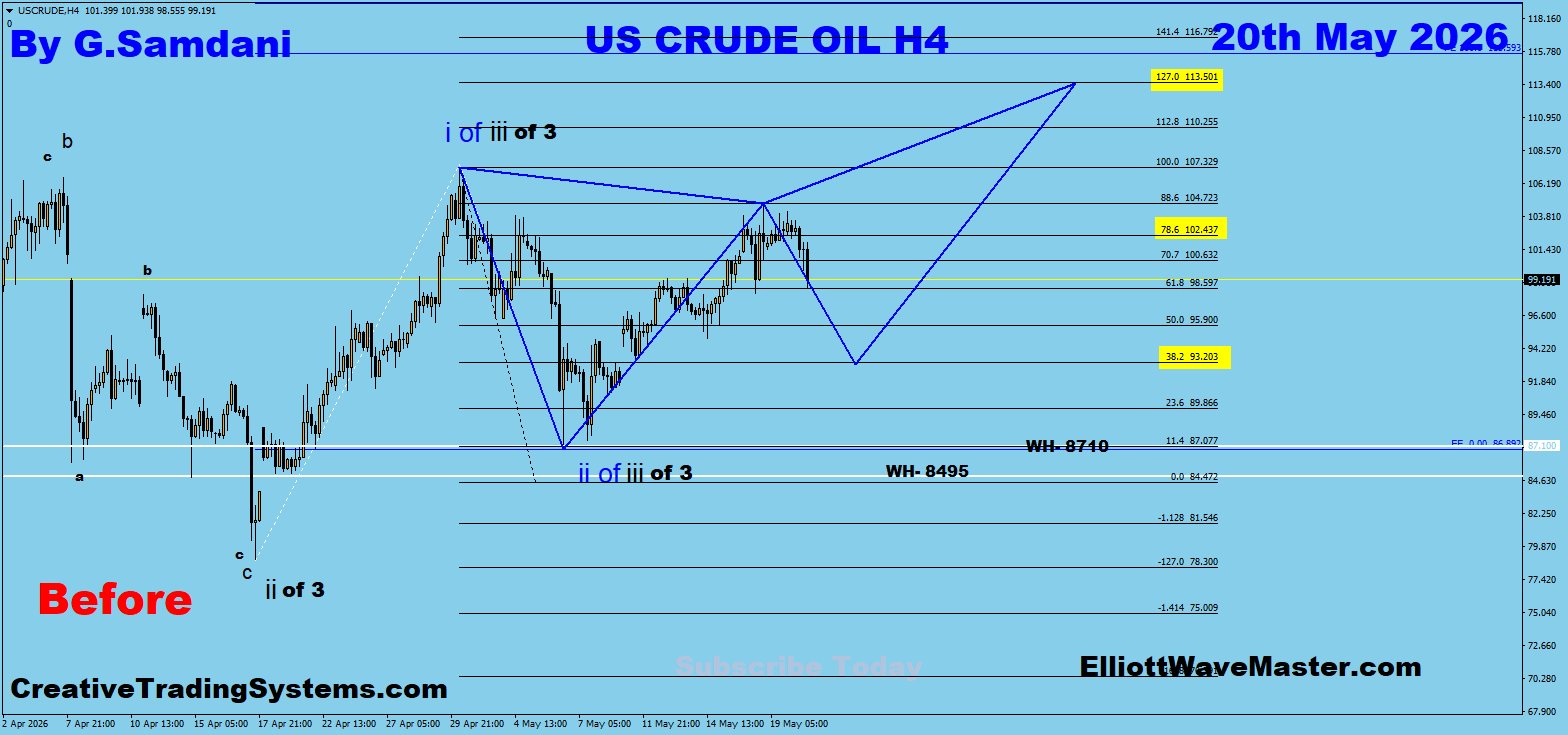
After
May 22 — Market outcome
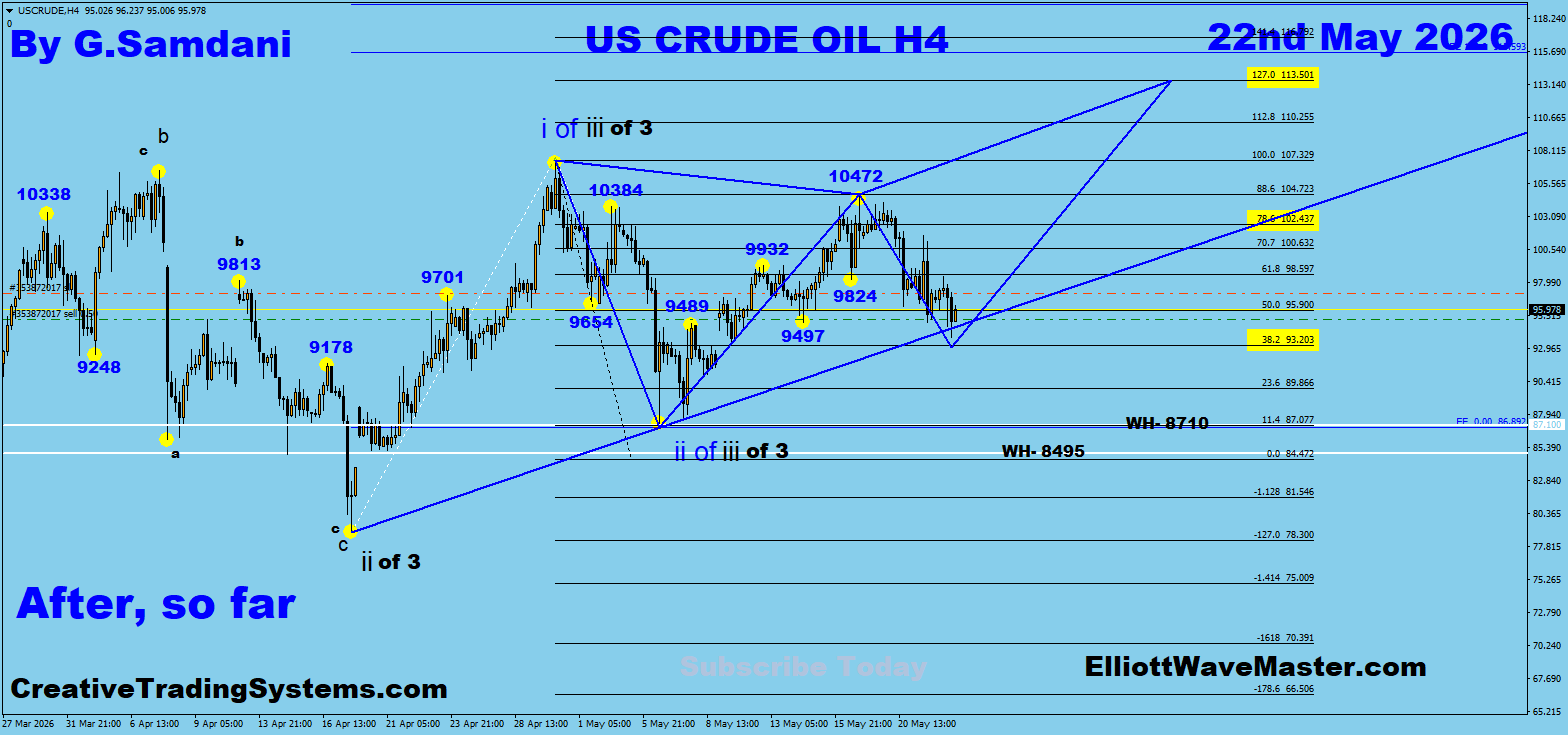
Analysis
On the H4 chart, price had completed Wave ii of iii within the broader Wave 3 structure, finding support at the WH-8495 zone near the 38.2% Fibonacci retracement ($93.20). The a-b-c corrective structure came in clean and price was showing early signs of turning. I projected Wave iii of 3 upward targeting the 127% Fibonacci extension at $113.50, with the 78.6% level at $102.44 as the first checkpoint. Entry was timed off a reversal candle on the lower timeframe. Price has since bounced from the wave ii low and is tracking the projected path — still developing toward the $113 target.
✅ Win
Before
May 16 — Marked-up analysis
After
May 18 — Market outcome
Analysis
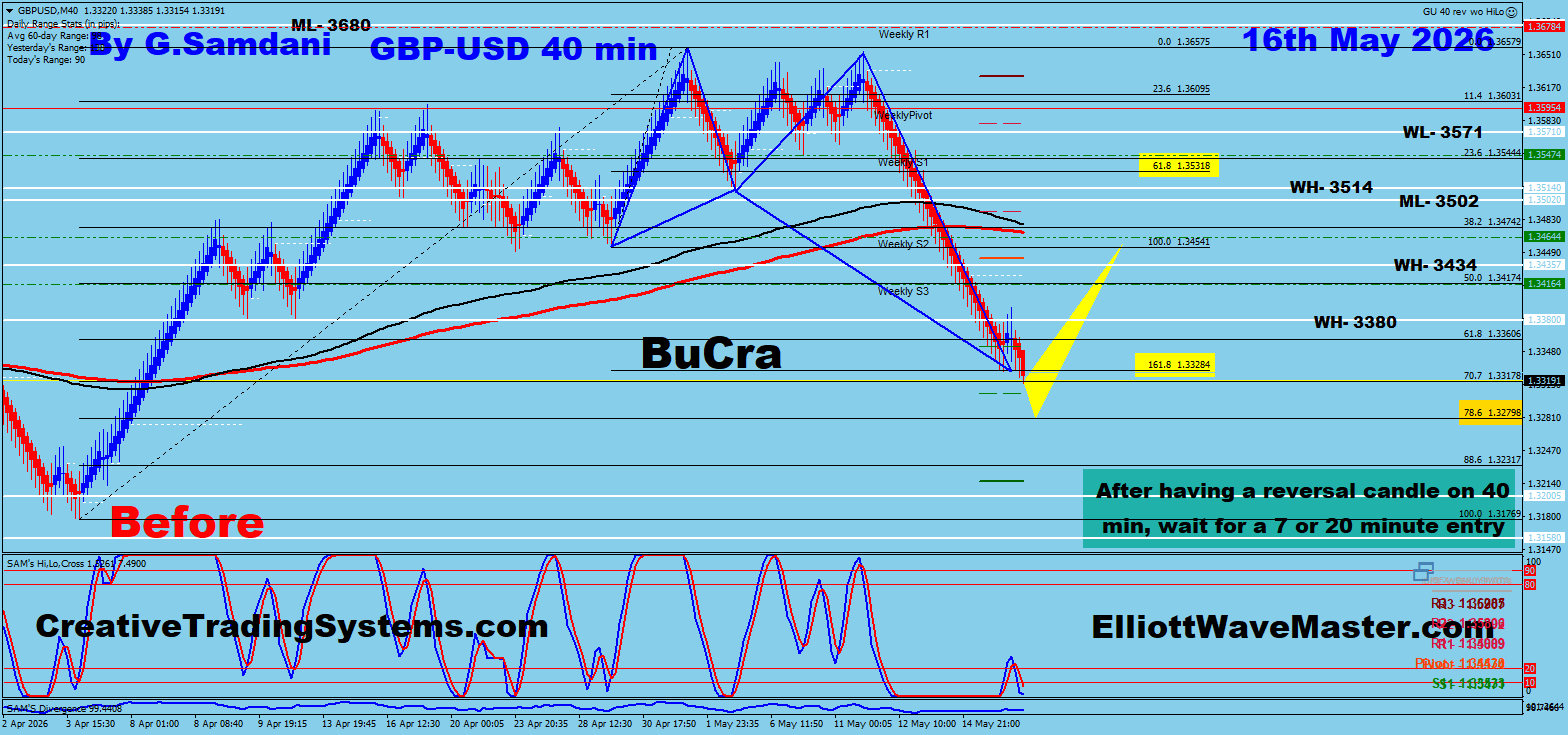
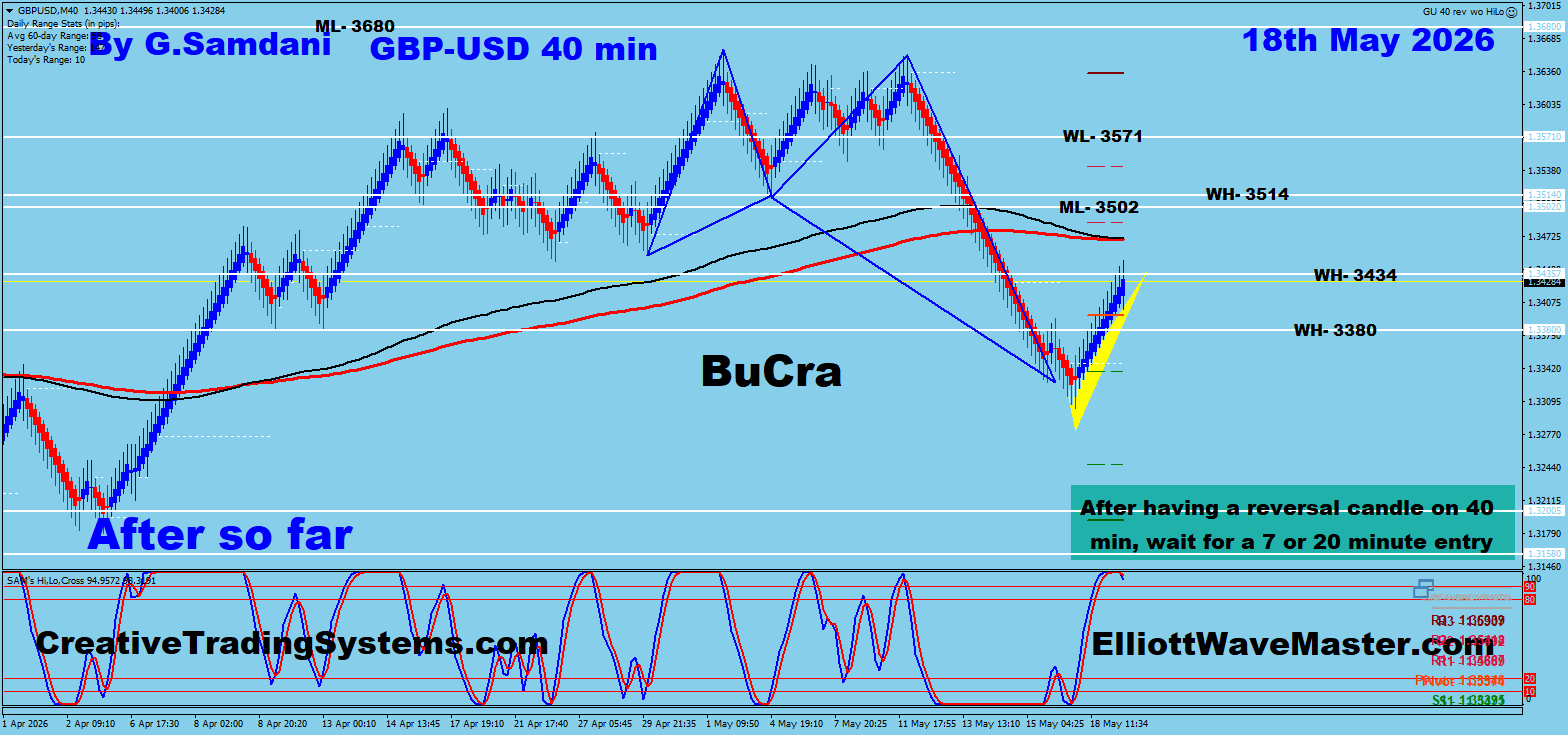
GBP/USD had been in a sharp decline and price reached the 161.8% Fibonacci extension at 1.33284 — the classic D-point completion zone for a BuCra (Butterfly/Crab) harmonic pattern. With the Weekly S2 level confluent at the same area and the oscillator deeply oversold, the setup was high probability. The plan was to wait for a reversal candle on the 40-minute chart, then drop to the 7 or 20-minute chart for a precision long entry. The BuCra completed exactly at the 161.8% level and price reversed sharply, rallying over 100 pips within two days back toward the 1.344 area — confirming the pattern played out as mapped.
✅ Win
Before
May 13 — Marked-up analysis
After
May 19 — Market outcome
Analysis
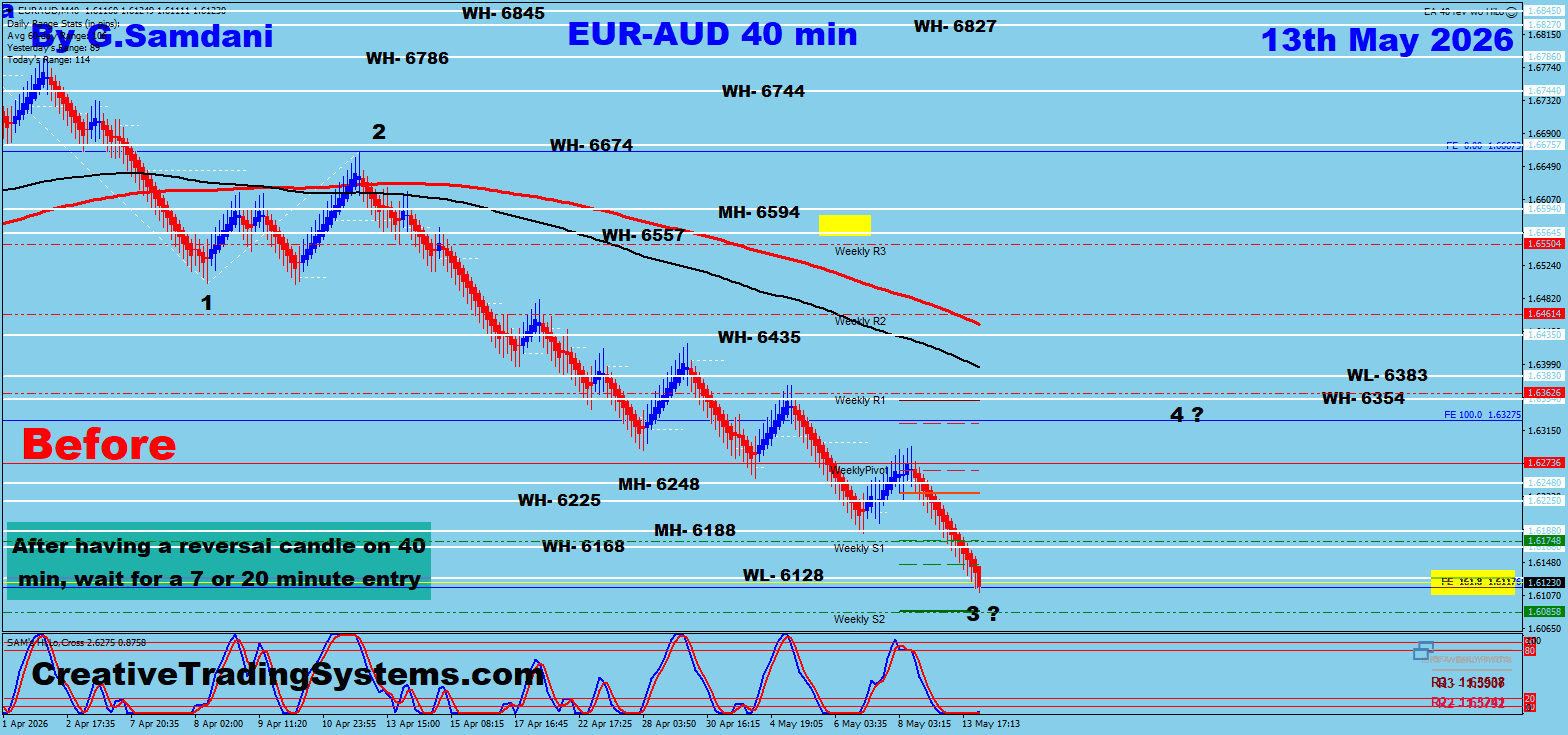
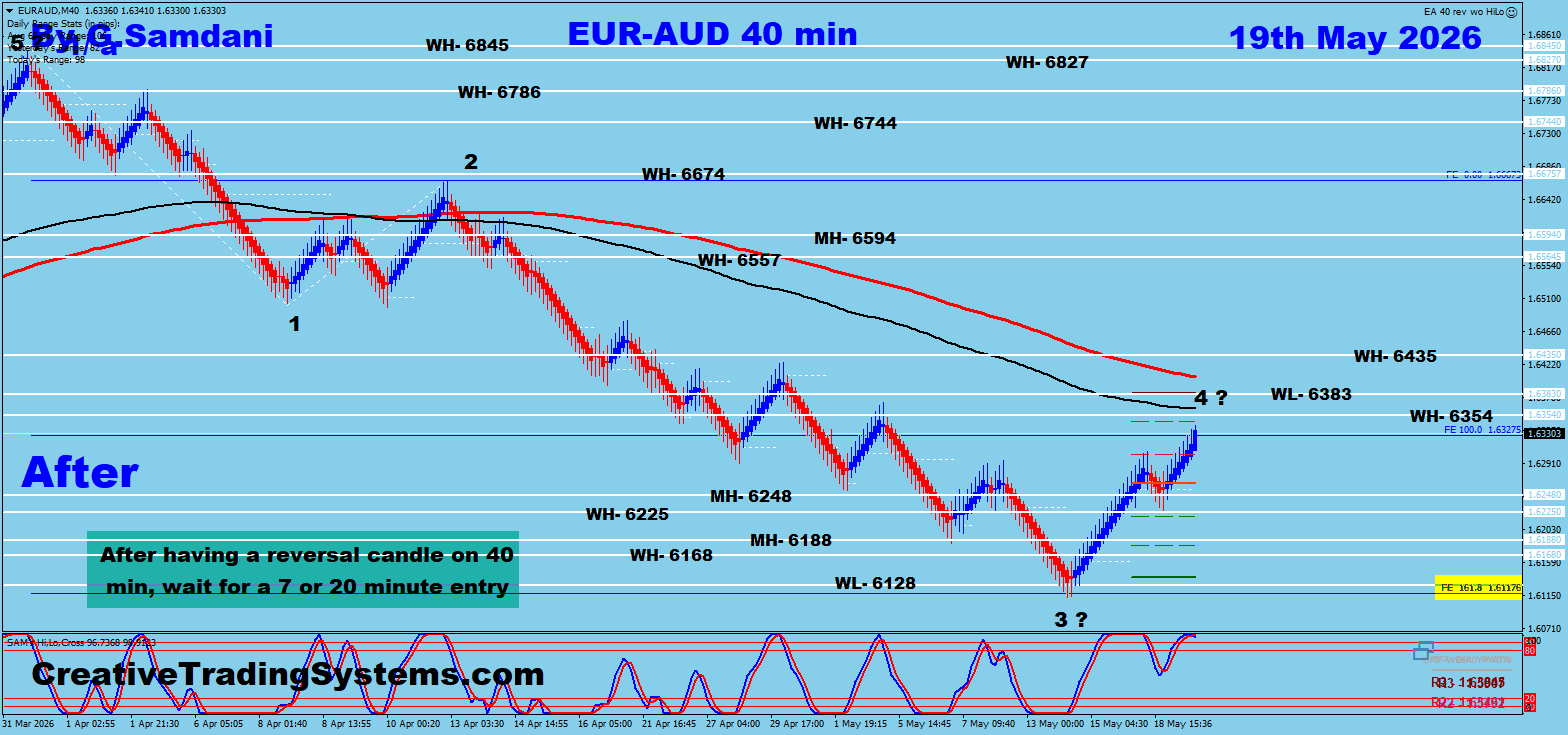
EUR/AUD was in a textbook 5-wave decline with Waves 1 and 2 already confirmed. Wave 3 was approaching exhaustion at the 161.8% Fibonacci extension (1.61176) — a level that stacked perfectly with Weekly S2 support and the WL-6128 zone, making it a high-confluence area for a Wave 3 terminus. The "3 ?" label marked where I expected the impulse to finish, with Wave 4 projected to retrace back toward the 1.633–1.636 area. After confirming a reversal candle on the 40-minute chart and entering on the lower timeframe, price bottomed precisely at the 161.8% FE and launched into Wave 4 — rallying over 200 pips to 1.633 within six days exactly as projected.
✅ Win
Before
May 13 — Marked-up analysis
After
May 18 — Market outcome
📈 Trade Taken
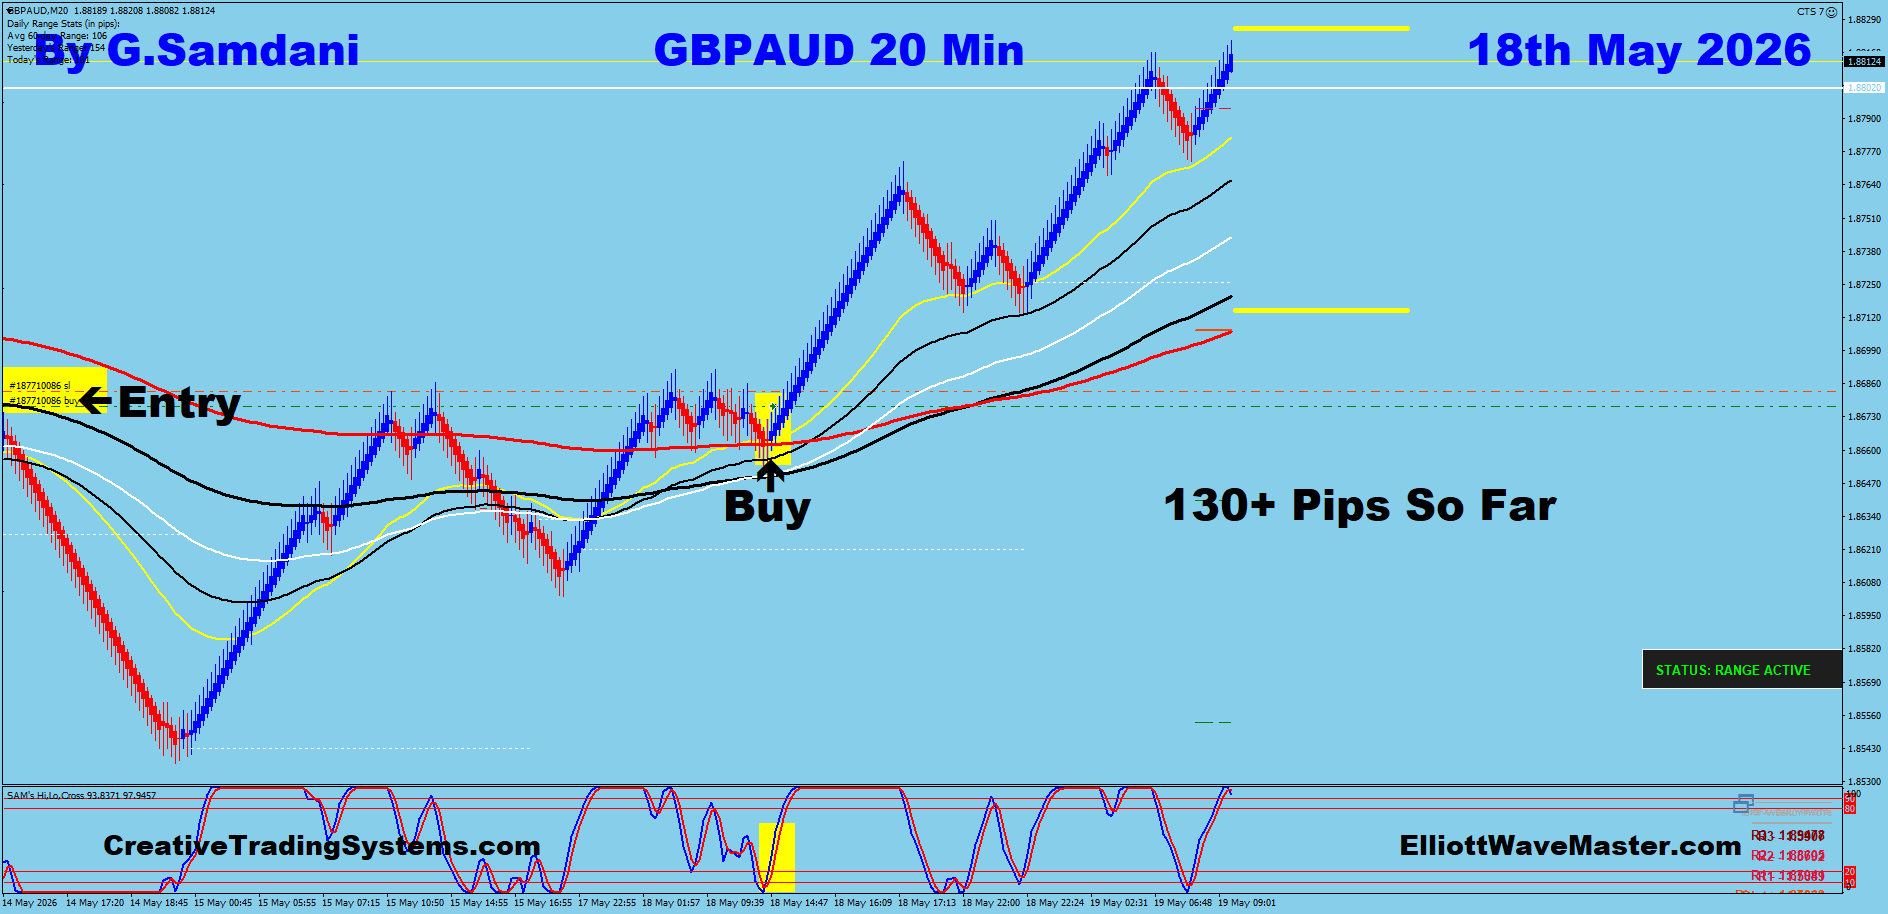
GBP/AUD Long — 20 Min Entry · May 18
Analysis
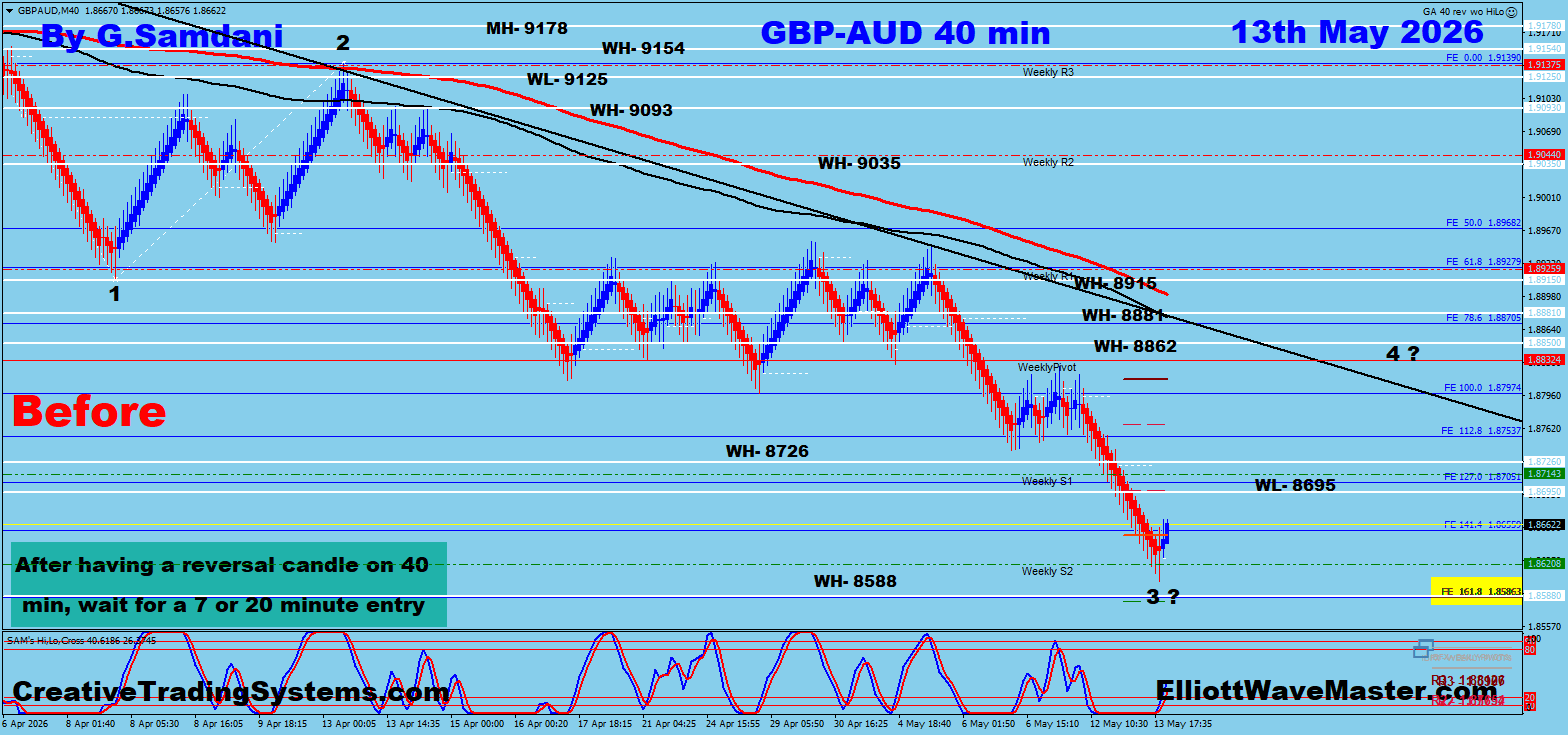
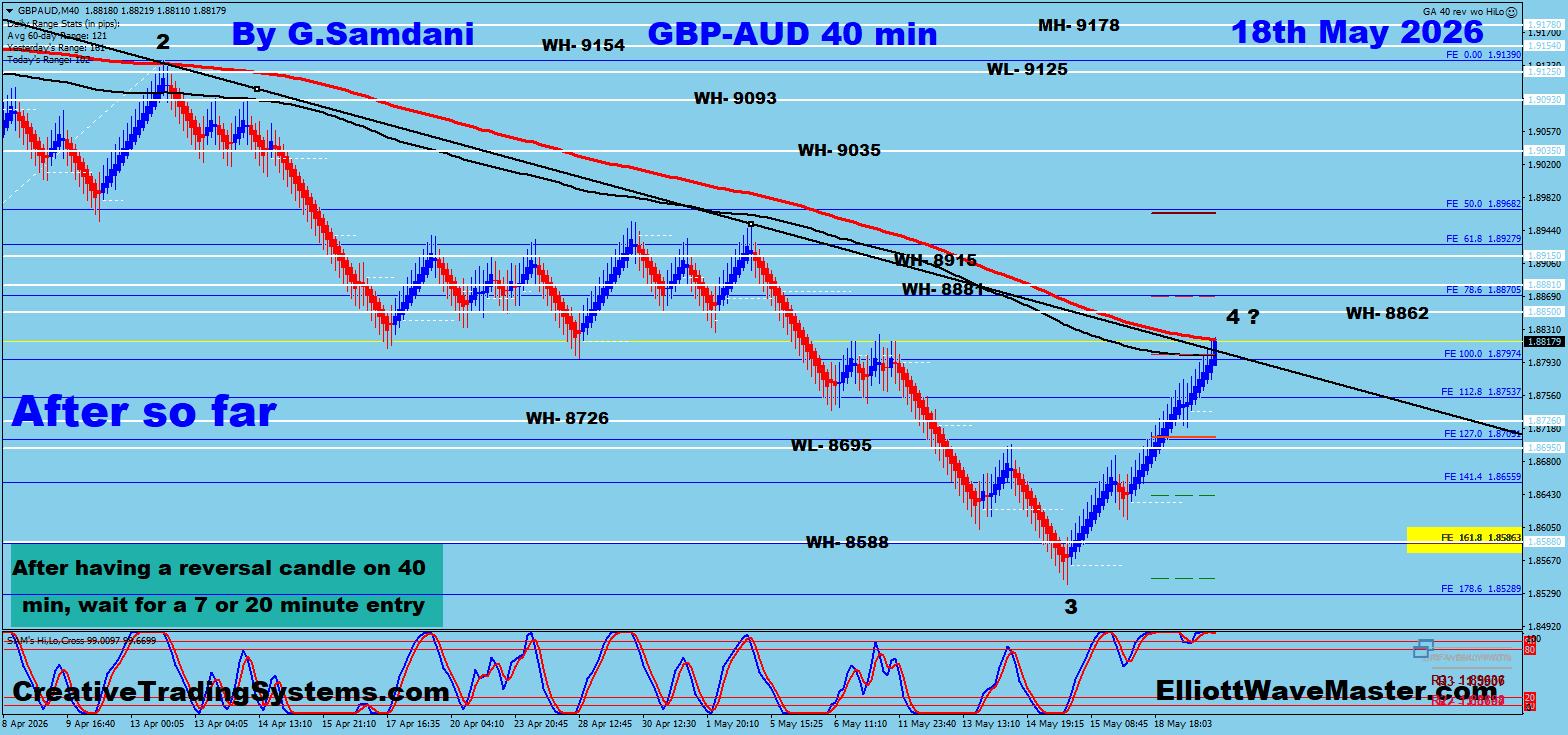
GBP/AUD was deep into a third wave decline with Waves 1 and 2 clearly defined on the 40-minute chart. The 161.8% Fibonacci extension at 1.85863 was the target for Wave 3's completion, aligning with Weekly S2 support and the WL-8695 zone for a strong confluence cluster. The "3 ?" label marked where I expected the impulse to exhaust, with Wave 4 projected to retrace upward from there. Entry was confirmed on a reversal candle on the 40-minute chart, then executed on the lower timeframe. Price hit the 161.8% FE precisely and reversed into Wave 4 — climbing over 150 pips to the 1.881 area within five days, tagging the WH-8862 resistance on the way up exactly as anticipated.